Animating in the Keyframe Editor
When you create two or more keyframes, Motion generates interpolated values for the frames that come between. These are called curves. The Keyframe Editor is where you can view and modify these curves, which is one of the most sophisticated and powerful ways to animate objects and effects in your project.
For example, in the real world, when objects move, they observe rules of physics, such as inertia and momentum. Motion’s Keyframe Editor allows you to simulate these effects in your motion graphics. The curves of animated parameters also provide another way of understanding how an effect changes over time. Curves are laid out in a graph where you can compare them, one over another.
The Keyframe Editor makes it easy to add and delete keyframes, as well as move them in two-dimensional space to modify their values (up-down) and their positions in time (left-right). You can also manipulate the curves with the tools Motion provides.
Further, you can define a variety of interpolation methods, creating dramatically different types of effects. You can also apply Parameter behaviors to curves in the Keyframe Editor by Control-clicking the curve name and choosing a Parameter behavior from the shortcut menu. For more information about Parameter behaviors, see Applying Parameter Behaviors and Parameter Behaviors.
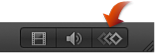
Click the Show Keyframe Editor button in the bottom-right corner of the Motion window.
Choose Window > Keyframe Editor.
Press Command-8.
Parts of the Keyframe Editor
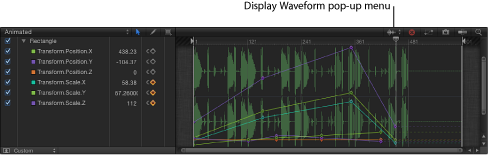
The Keyframe Editor is made up of a list of parameters on the left and a multifunctional graph on the right.
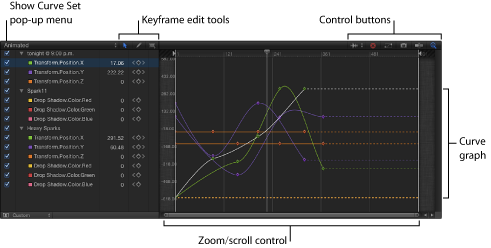
Show Curve Set Pop-Up Menu
The Show Curve Set pop-up menu lets you filter the parameters in the Keyframe Editor, allowing you to focus on those parameters you want to modify. For more information, see Working with the Show Curve Set Pop-Up Menu.
Keyframe Editing Tools
Three tools are available to assist in editing keyframes and curves in the Keyframe Editor:

- Transform Keyframes tool: Lets you drag a selection box to enclose and manipulate a group of keyframes simultaneously.
For more information about using these tools, see Modifying Keyframes.
Parameter List
Any keyframeable parameters of selected objects can be displayed in the list on the left side of the Keyframe Editor. This includes object properties, filters, and behaviors. By selecting multiple items in the Layers list or Timeline, you can compare parameters across multiple objects.
The parameter list contains the following items:
- Value: Parameter values at the playhead position appear in the third column. Modify a parameter value by dragging left or right over the number in this field. Or double-click the field, then enter a value. The value displayed and editing options depend on several factors:
If the playhead is parked on a keyframe, this field shows the value for that keyframe. Adjusting the value alters the keyframe.
If the playhead is not parked on a keyframe, this field shows the value of that parameter at the current frame. If the parameter has keyframes, adjusting the value creates a new keyframe at that frame.
For more information on changing the values of keyframes, see Modifying Keyframes. For more information on value sliders, see Value Sliders.
- Keyframe and Keyframe Navigation buttons: Keyframe controls appear in the fourth column. These controls are identical to those found in the Inspector: the Previous Keyframe button, Add/Delete Keyframe button, and Next Keyframe button. For more information, see Keyframe Controls.
- Animation menu: The Animation menu appears in the fifth column. To open this menu, position the pointer over this column, then click the inverted arrow that appears. The Animation menu in the Keyframe Editor contains all commands found in the Inspector’s Animation menu, plus a few additional commands:
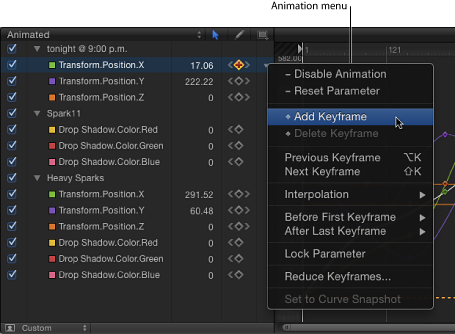
- Enable/Disable Animation: Activates or deactivates the keyframed value. Choosing Disable Animation hides the keyframes you set, restoring the parameter to its default value. However, the keyframes are not thrown away. Choosing Enable Animation returns the parameter to its last keyframed state.
- Reset Parameter: Removes keyframes and settings for the parameter, restoring the default value.
- Add Keyframe: Adds a keyframe at the current frame in the Keyframe Editor. If the playhead is positioned on a frame where a keyframe has been added, this command is unavailable.
Note: You can use a keyboard shortcut (Control-K) to add a keyframe. A keyframe is added to the last modified parameter of the object.
- Delete Keyframe: Deletes the current keyframe. This command is available if the playhead is positioned on a frame where a keyframe exists.
- Previous Keyframe: Moves the playhead to the previous keyframe for this parameter. This command is available if a keyframe exists earlier in the project.
- Next Keyframe: Moves the playhead to the next keyframe for this parameter. This command is available if a keyframe exists later in the project.
- Interpolation: Sets the type of curve for the parameter. See Modifying Curves for examples of the different interpolation methods. Choose Constant, Linear, Bezier, Continuous, Exponential, or Logarithmic.
- Before First Keyframe: Defines what happens between the first keyframe and the beginning of the clip. See Extrapolation for examples of extrapolation methods. Choose Constant, Linear, Ping Pong, Repeat, or Progressive. You can also turn the extrapolation into keyframes by choosing Generate Keyframes.
- After Last Keyframe: Defines what happens between the last keyframe and the end of the clip. See Extrapolation for examples of extrapolation methods. Choose Constant, Linear, Ping Pong, Repeat, or Progressive. You can also turn the extrapolation into keyframes by choosing Generate Keyframes.
- Lock/Unlock Parameter: Locks the parameter from changes. When a parameter is locked, neither keyframes nor curves are adjustable.
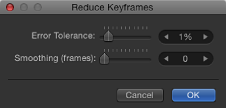
- Reduce Keyframes: Opens the Reduce Keyframes dialog, which allows you to apply a thinning algorithm to the keyframes for the parameter. This reduces the number of keyframes in a parameter while preserving the shape of the curve. The thinning algorithm can be adjusted in two ways. Increasing the Maximum Error Tolerance results in fewer keyframes. Increasing the Smoothing Factor makes smoother curves between keyframe values.
- Set to Curve Snapshot: Reverts keyframe changes made in the selected curve to the most recent snapshot. This command is available when Take/Show Curve Snapshop is turned on (the camera button in the upper-right corner of the Keyframe Editor). For more information, see Curve Snapshots.
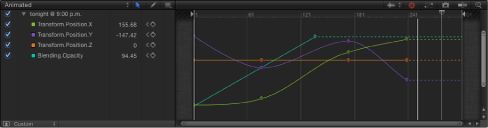
Keyframe Graph
The graph appears on the right side of the Keyframe Editor and displays the curves of selected parameters. The graph has a time ruler at the top and a zoom/scroll control at the bottom and side that are identical to the corresponding controls in the Timeline. The time ruler shows where keyframes, project markers, playback In and Out points, and the playhead are. Using the zoom controls at the bottom of the graph, you can focus on regions of the sequence to edit. For more information on using the zoom/scroll controls, see Zooming in the Timeline.
The body of the graph displays the keyframes and curves of active parameters (those in the parameters list). Each curve is a different color, although some colors are duplicated.
Control Buttons
In the Keyframe Editor, several buttons provide additional control over the Keyframe Editor window:
- Choose Background Audio Waveform: A pop-up menu that lets you turn on the display of audio waveforms for the selected item in the background of the graph. This lets you line up an effect to take place at the same time as an event that occurs in the audio. If there are multiple audio tracks in the project, you can use this menu to view the waveform of any individual audio track in the project, or the master track.
- Fit Visible Curves in Window: A button that scales the curve graph to show all keyframes of active parameters. There are times when the values of keyframes exceed the vertical resolution of the graph. For example, as you stretch a keyframe, you can drag it so far that you force the window to scroll.
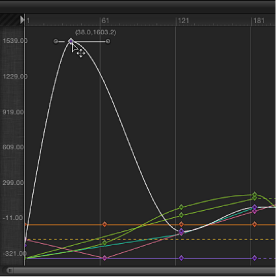
When you click the Fit Visible Curves in Window button (shown below), Motion rescales the graph vertically and horizontally so the curve is entirely visible.
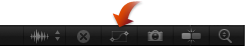
When you click the Auto-Scale Vertically to Fit Curves button (shown below), Motion rescales the graph vertically so the curve is entirely visible.

When you use either of these buttons, the values of your keyframes are not changed.
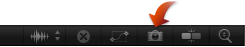
- Take/Show Curve Snapshot: A button that, when clicked, shows the state of all curves in the Keyframe Editor. With a snapshot turned on, the original unaltered curve is represented by a lighter color—visible in the background behind the curves you are adjusting—and can be used as a reference showing the curve's original values. As long as you remain in the Keyframe Editor editing the current set of curves, the snapshot curve remains available. Clicking this button again causes the current snapshot to disappear. For more information about curve snapshots, see Curve Snapshots.
- Auto-Scale Vertically to Fit Curves button: A button (the magnifying glass in the upper-right corner of the Keyframe Editor) that continuously stretches the graph vertically to show all curves.
When Auto-Scale Vertically to Fit Curves is on, the vertical range of the graph increases to accommodate the entire curve even as you change it. For example, if you drag a keyframe up to increase its value, as you drag past the top of the window, the whole graph is rescaled, rather than scrolled.
This can be disconcerting because it might appear that a curve refuses to get bigger even as you drag a keyframe. However, if you watch the values at the left side of the window, you can see that the graph is zoomed vertically to make room for your wider range of values.
Viewing the Keyframe Editor on a Second Display
You can show the Keyframe Editor on a second display, providing a larger workspace for modifying keyframes and curves. For more information, see Viewing the Canvas or Timing Pane on a Second Display.