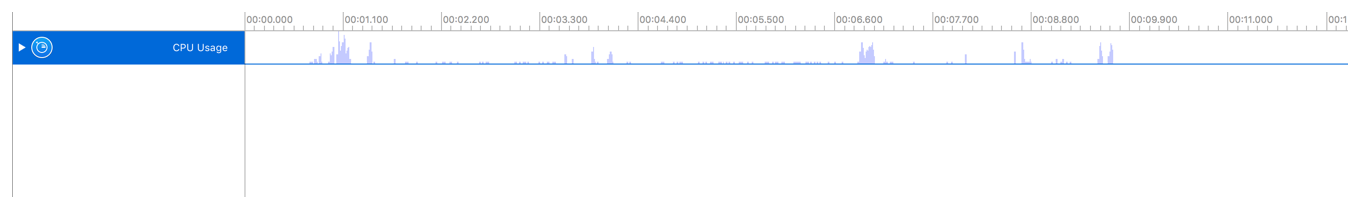
The timeline pane displays a graphical summary of the data recorded for a given trace. In this pane, each instrument, CPU core, or thread has its own “track,” which provides a graphical chart of the data collected.
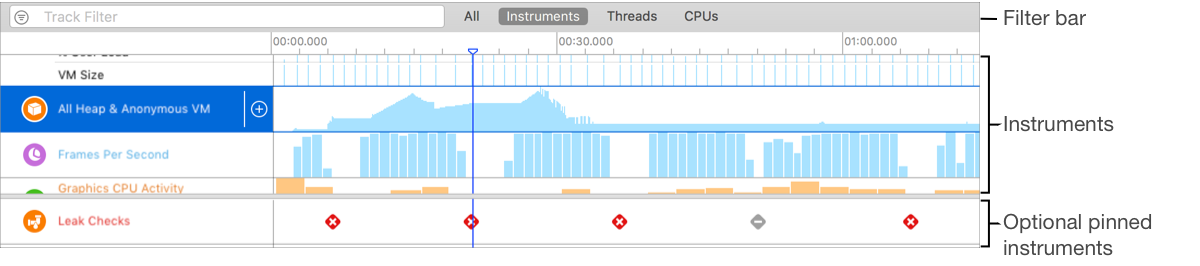
Although this pane’s information is read-only, you can scroll through data, select specific areas for closer examination, and insert flags to highlight points of interest. You can change how graphical information is displayed here by adjusting the zoom level or by changing the display settings of individual instruments using the display configuration popover. An optional filter bar provides controls for filtering the data displayed by an instrument. For example, the Sampler instrument can filter the data by thread.
You can pin timelines to the bottom of the pane to keep important information visible as you investigate issues. For example, you can pin the Leaks instrument to the bottom of the pane, and then scroll through the other instruments to find the possible causes for a leak. Pinned instruments are not preserved between runs.
Strategy views
Click the strategy buttons in the filter bar to display instruments, CPU core, thread data, or all three items in the timeline.

All: Show data for instruments, threads, and CPUs in the timeline.
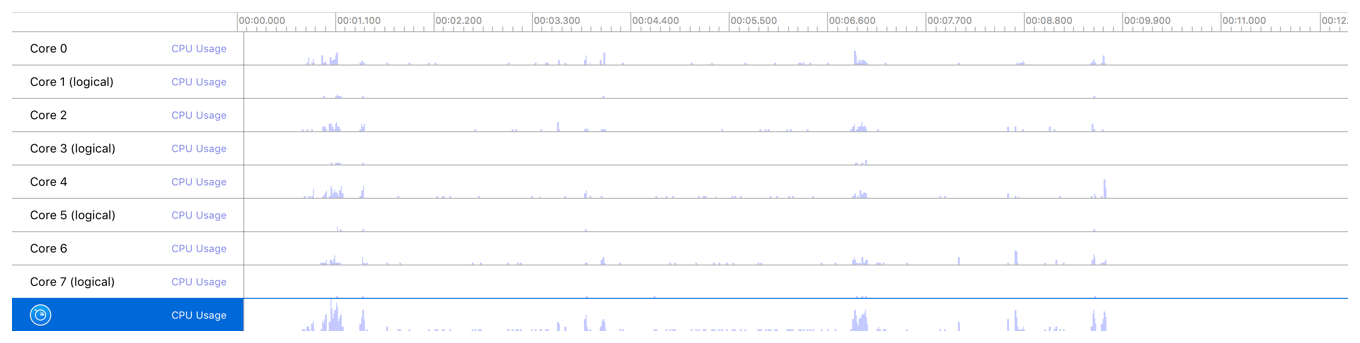
CPUs: Displays a list of CPU cores, along with their usage over time, in the timeline pane. Only available when a trace document contains instruments that record CPU data.
Instruments: Displays a list of instruments and their corresponding data in the timeline pane.
If you select an instrument in the list, you can delete it or configure it in the inspector pane. The instruments list is visible by default when you create a trace document.
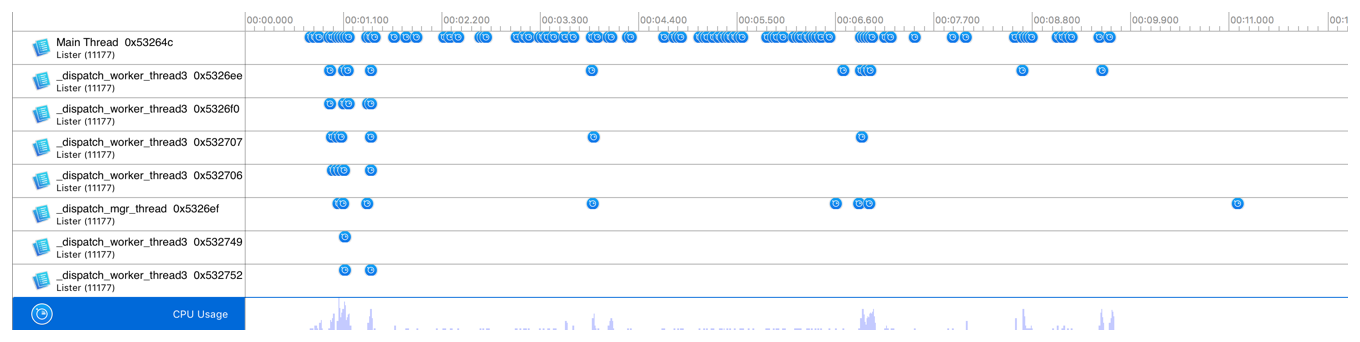
Threads: Displays a list of threads and their utilization data in the timeline pane. Only available when a trace document contains instruments that record thread data.