Use the display configuration popover to configure what data is displayed in the timeline and to configure the format of the displayed data.
The settings available in the display configuration popover vary, depending on the instrument. These settings can help you:
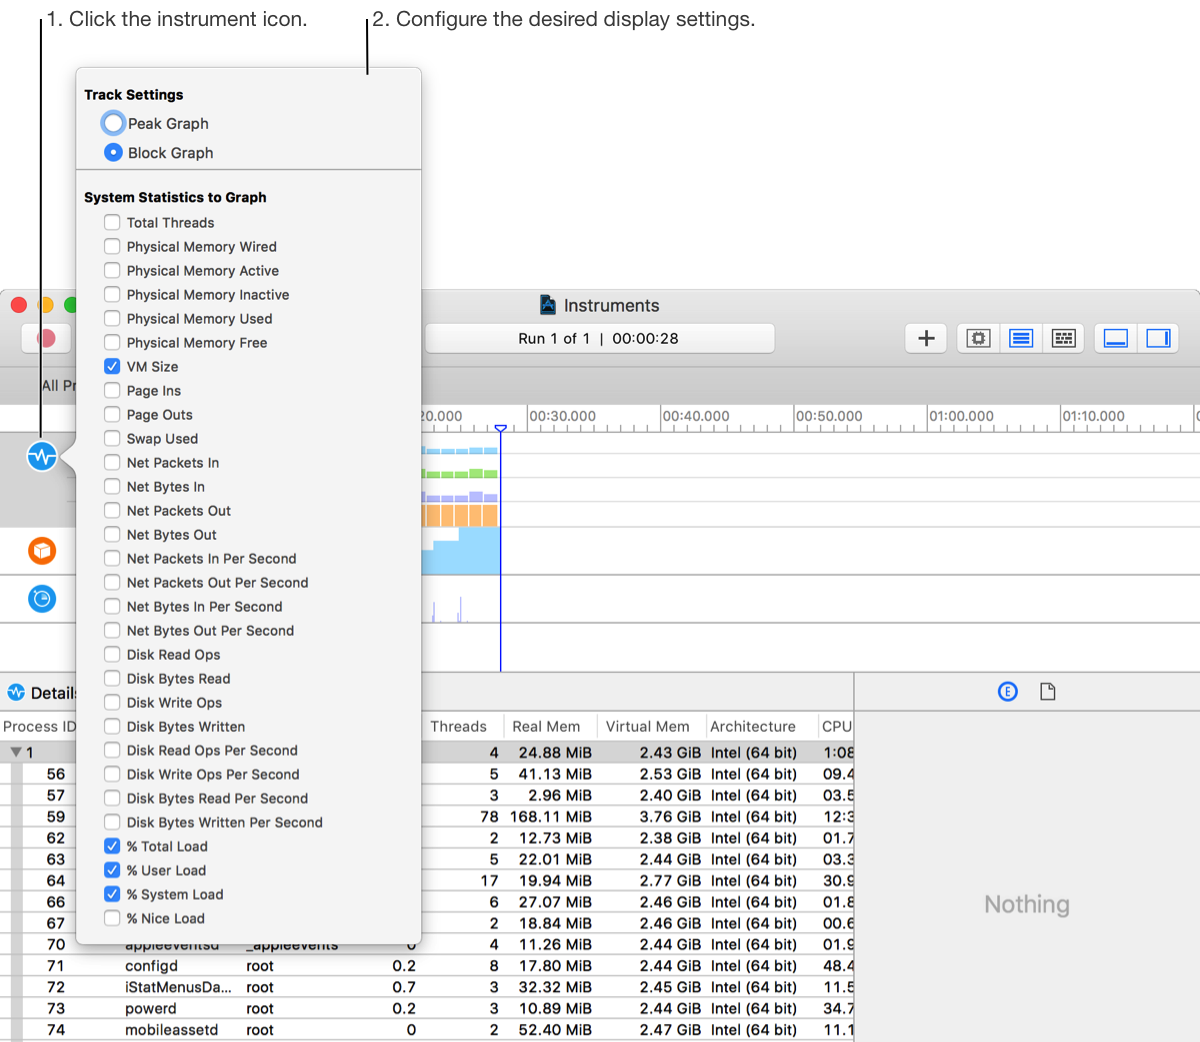
Control the data that appears in the timeline. For example, the Activity instrument allows you to toggle the display of total threads, VM size, and several other system statistics.
Adjust how recorded information is represented in the timeline view. For example, an instrument may allow you to switch between a peak graph and a block graph.
To open the popover, click the instrument icon in the trace document timeline pane. Instruments that support a display configuration popover show an indicator when the pointer is moved over the icon.