
A trace document is used to organize and configure instruments for profiling, initiate data collection, and view and analyze the results. You create a new trace document by launching Instruments and choosing a profiling template or by initiating profiling from Xcode, the Dock, or the command line. You can also save and reopen trace documents in which you’ve configured instruments and collected data. A trace document can contain a lot of extremely detailed information, and this information is presented to you through a number of panes and areas.
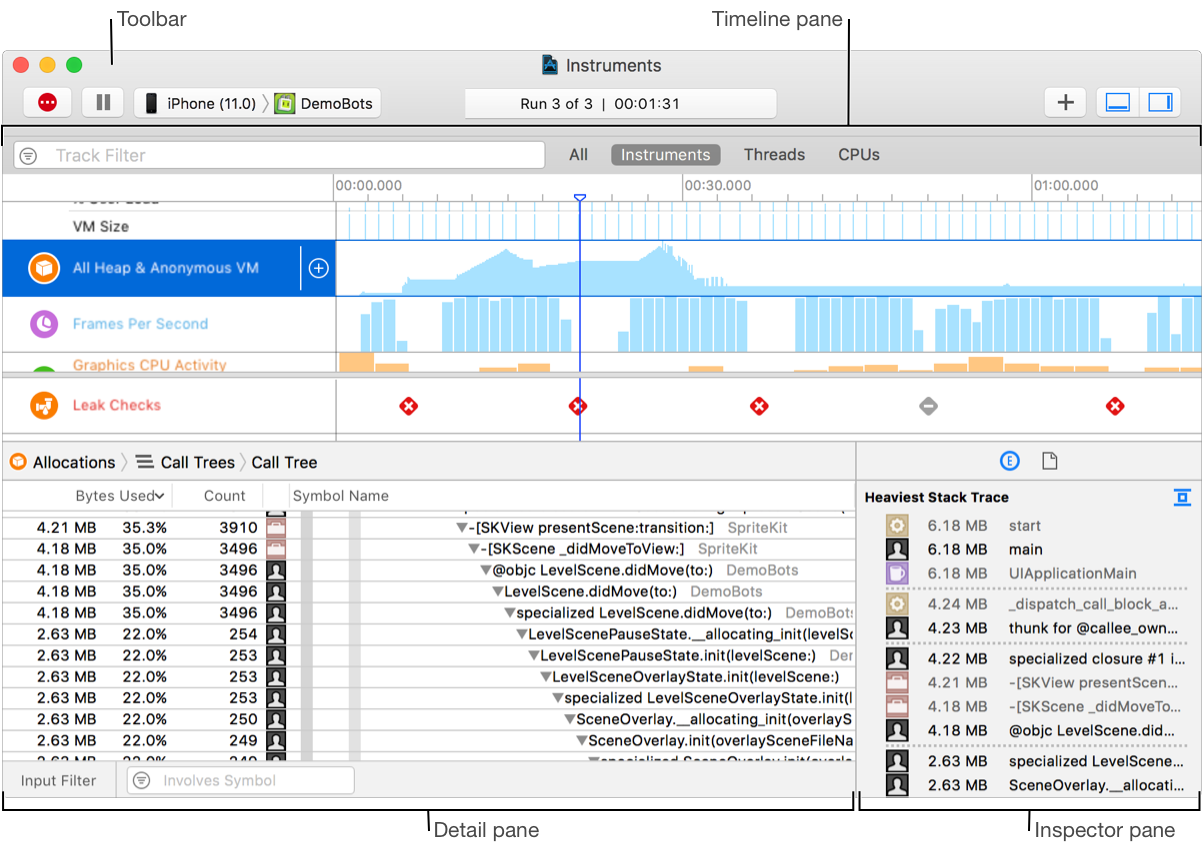
The trace document includes the following main areas:
Toolbar: Allows you to start, pause, and stop data profiling, add instruments, hide and show panes, and more. See About the trace document toolbar.
Timeline pane: Displays a graphical summary of the data recorded for a given trace. See About the trace document timeline pane.
Detail pane: Shows detailed information about the data collected by the instruments in your trace document. See About the trace document detail pane.
Inspector pane: Contains summary information about the current data record and instrument specific extended detail. See About the trace document inspector pane.