The toolbar of the trace document lets you start, pause, and stop data profiling, add instruments, hide and show panes, and more.
The toolbar includes the following main elements:
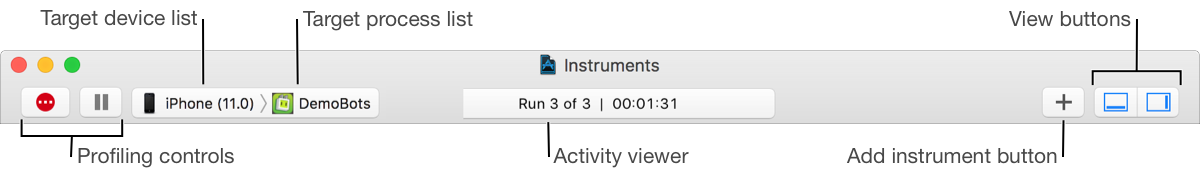
Profiling controls: Allow you to record, pause, and stop data collection.
Target device list: Allows you to select the device on which you wish to profile.
Target process list: Allows you to select the process or processes to profile.
Activity viewer: Shows the number of runs for the trace document and the elapsed time of the current trace.
Add Instrument button (+): Shows or hides the instruments Library palette, which contains a complete list of available instruments. From here, you can select individual instruments and add them to your trace document.
View buttons (![]() ): Hide or show the detail pane and inspector.
): Hide or show the detail pane and inspector.