
Use the Debug navigator to examine threads and stack information, or to monitor debug gauges while your app is running in a debug session. The Debug navigator opens automatically when you pause the execution of your app (click the Pause button in the debug area) or your app reaches a breakpoint in the code. To open the Debug navigator yourself, click the Debug Navigator button (![]() ) in the navigator area.
) in the navigator area.
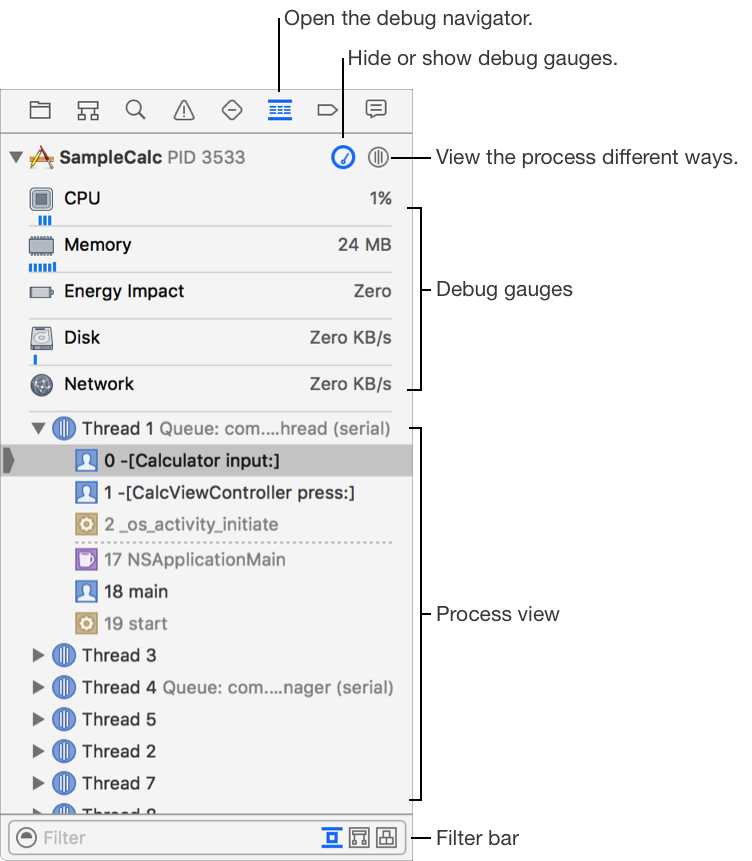
The debug gauges allow you to see how your app is consuming CPU power, memory, and other resources. The process view groups the stack frames by threads or queues and lists the memory locations. Each stack frame displays an icon denoting its category.
Hide or reveal the details of a process: Click the disclosure triangle.
View details about an item: Choose an item and information appears in the editor area and debug area.
Toggle the display of debug gauges: In the top-right corner, click the Hide/Show Debug Gauges button (![]() ).
).
Display threads organized as a flat list: In the top-right corner, click the process view selector icon (![]() ) and choose View Process by Thread.
) and choose View Process by Thread.
Group threads under the dispatch queue that created them: Click the process view selector icon (![]() ) and choose View Process by Queue.
) and choose View Process by Queue.
Display the view hierarchy in the process view while rendering the UI in the editor area: Click the process view selector icon (![]() ) and choose View UI Hierarchy. This action pauses the running app.
) and choose View UI Hierarchy. This action pauses the running app.
View the memory graph: Click the process view selector icon (![]() ) and choose View Memory Graph Hierarchy.
) and choose View Memory Graph Hierarchy.
Remove a memory location from the list in the process view: Select the memory location and press Delete.
Filter the threads and stack frames: In the filter bar, enter text that matches the threads or queues you want to view.
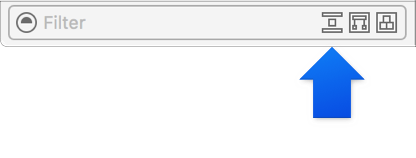
Show stack frames without debug symbols and between libraries: Click the left button in the filter bar.
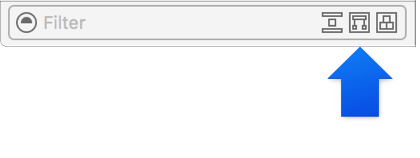
Show crashed threads and threads with debug symbols: Click the middle button in the filter bar.
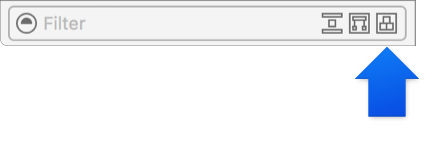
Show running blocks when displaying queues: Click the right button in the filter bar.
Note: Xcode includes the recorded backtrace prior to the current stack frame in both thread and queue view modes.
In View Process by Thread or View Process by Queue mode, a status icon indicates the running state of threads:
Icon | Description | ||||||||||
|---|---|---|---|---|---|---|---|---|---|---|---|
None | The thread is running normally. | ||||||||||
Yellow | The thread is blocked and waiting on a lock or condition. | ||||||||||
Red | The thread is suspended. A suspended thread does not execute code when you resume your app. | ||||||||||
Gray | The thread or block is part of the recorded backtrace and is not currently executing. | ||||||||||