
Use the Xcode debugger to inspect your code while running your app. The Debug navigator and debug area automatically appear when you build and run your app. If necessary, show the navigator area by clicking the left button (![]() ) and show the debug area by clicking the middle button (
) and show the debug area by clicking the middle button (![]() ) on the right of the toolbar.
) on the right of the toolbar.
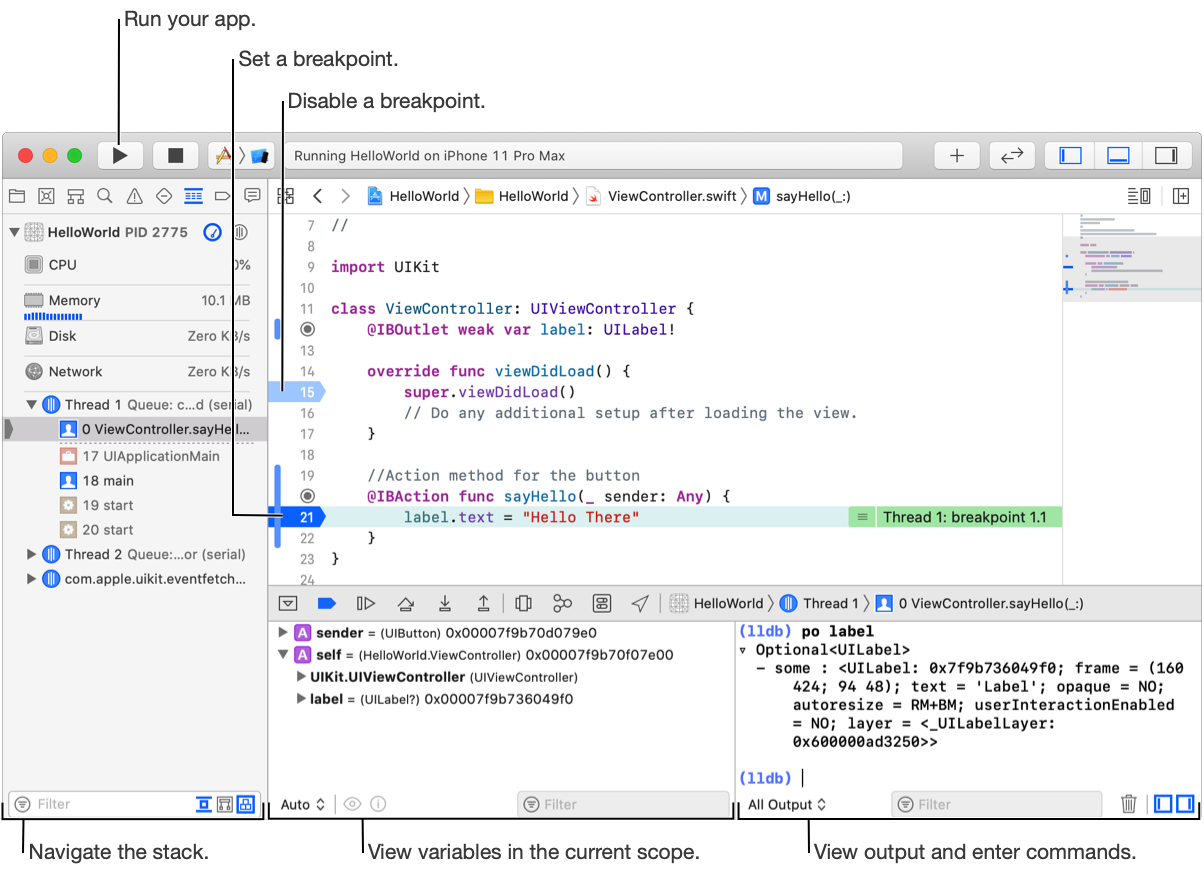
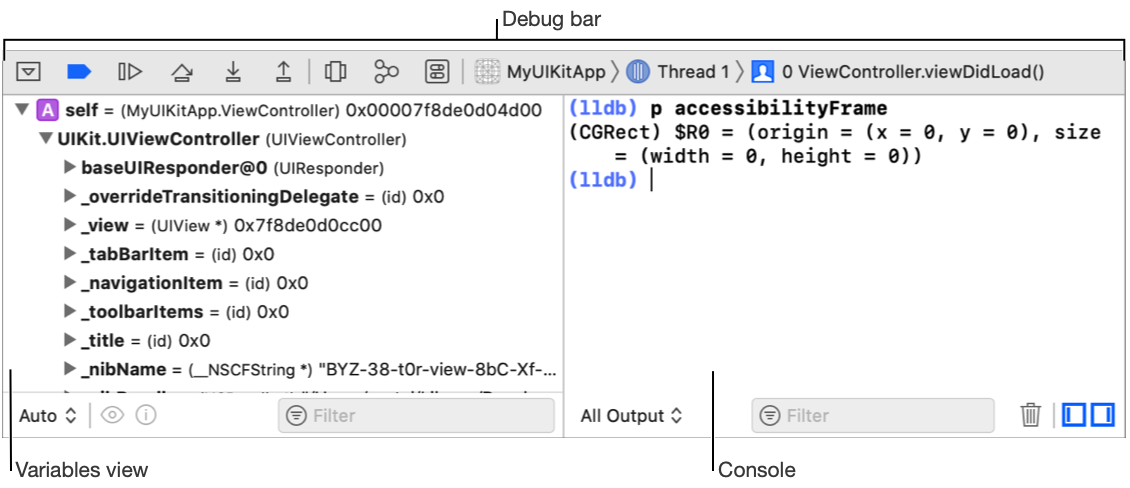
The three main components of the debug area are:
The debug bar contains buttons that disable or enable all breakpoints, control the execution of your app, enable graphical debugging of view and memory state, simulate location, override environment settings, and jump to stack frames.
The variables view presents the list of variables available to inspect in the scope of your present location in the code. This list is a disclosable hierarchy, revealing the values of all parts of a variable’s structure as you progressively click the disclosure triangles.
The console contains an interactive Terminal-like text area. You use it to interact directly with LLDB, see output from use of Print Description, and work with standard input and output from your app. For example, enter po [expression] and the debugger executes the expression. As you type an expression, the debugger offers suggestions for completing it similar to the source editor.
You can debug multiple apps or processes at the same time. Each session requires a separate project window.