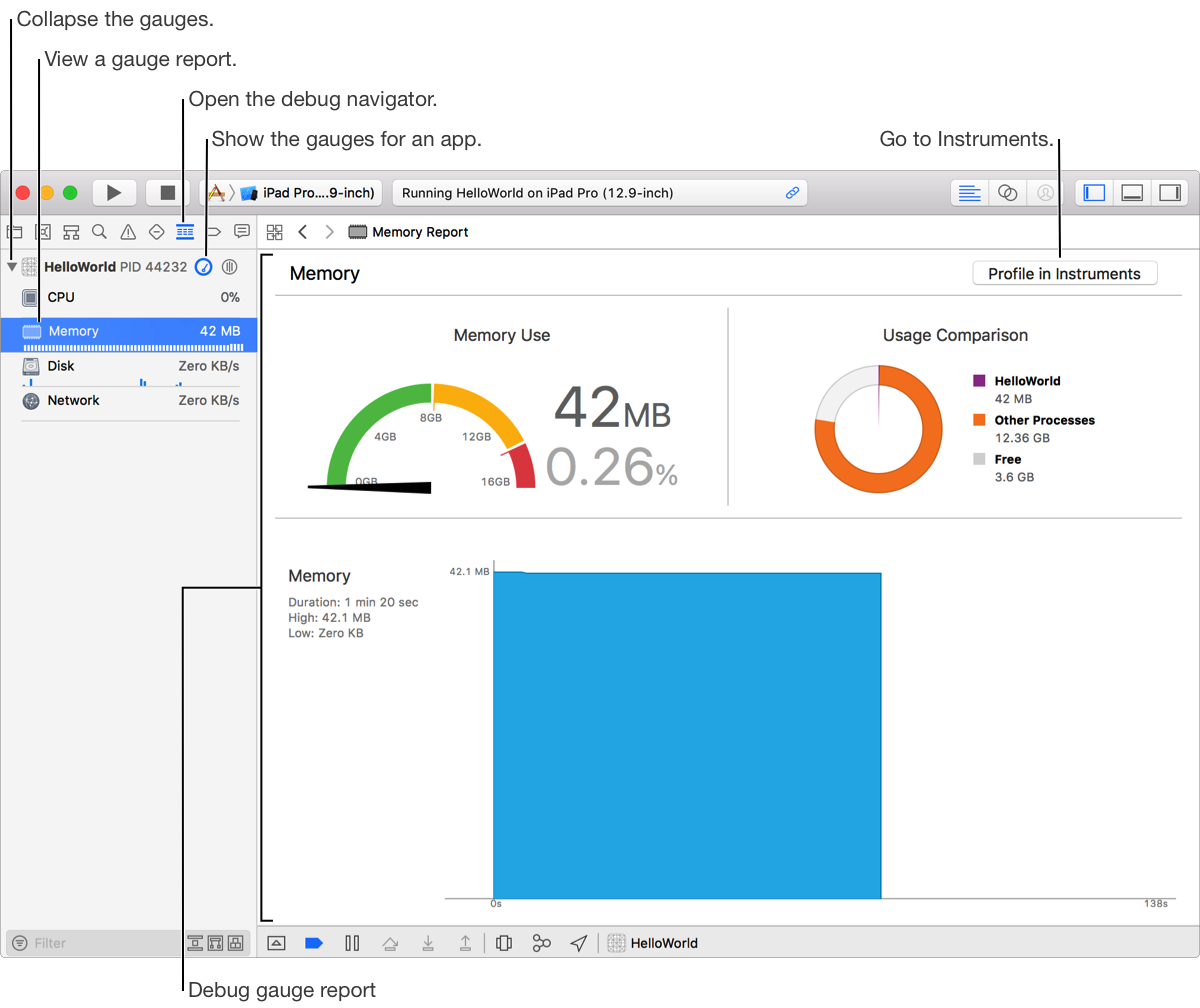
The debug gauges are listed in the Debug navigator when your app runs. There are seven types of debug gauges, which are displayed depending on platform and app capabilities: CPU, Memory, Energy, Disk I/O, Network I/O, GPU, and iCloud. Select one to view a histogram and activity in the editor area. These gauges provide insight into how your app is performing in its use of system resources.