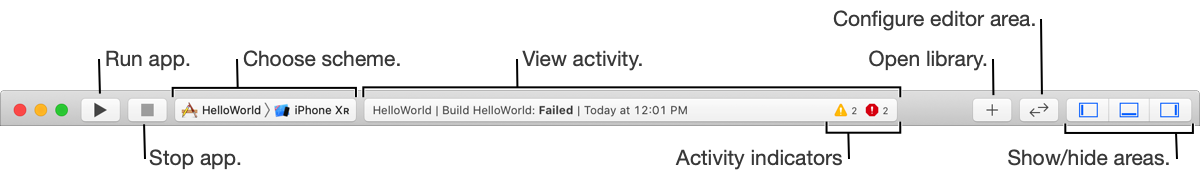
Use the toolbar to build and run your app, view progress and status of tasks, and configure areas of the main window. You’ll choose the target and run destination—for example, a simulator or device—from the scheme menu. Also, use the toolbar to choose an editing mode and to show or hide the main window areas.
To show the toolbar, choose View > Show Toolbar.
Tasks you can perform are:
Run the current project: Click the Run button.
Test, profile, or analyze the current projectClick and hold the Run button, then choose an action from the pop-up menu.
Terminate the running code: Click the Stop button.
Change the target and run destination (device or simulator): Choose a project target and run destination from the scheme menu.
Keyboard shortcuts are:
Open the scheme menu: Press Control-0 anywhere in the project editor.
Open the scheme runtime menu: Press Control-Shift-0 anywhere in the project editor.
Open the scheme editor: Option-click the Run button.
The activity view shows the progress of any executing tasks, displays status messages, and shows activity indicators.
Icon | Name | Description | |||||||||
|---|---|---|---|---|---|---|---|---|---|---|---|
| Warning | Appears when there are issues with the project. Clicking on the warnings indicator opens the Issue navigator. | |||||||||
| Error | Appears when there are errors that will prevent the project from building. Clicking on the errors indicator opens the Issue navigator. | |||||||||
| Ambiguity | Appears when the view hierarchy in the current view debug session contains ambiguous constraints. | |||||||||
| Alternative toolchain | Appears when an alternative toolchain is selected. Clicking on the button opens the Toolchains pane of Components preferences. | |||||||||