
In the debug area, inspect the value of a variable to uncover a problem in your source code. The debug area automatically opens when you build and run your app.
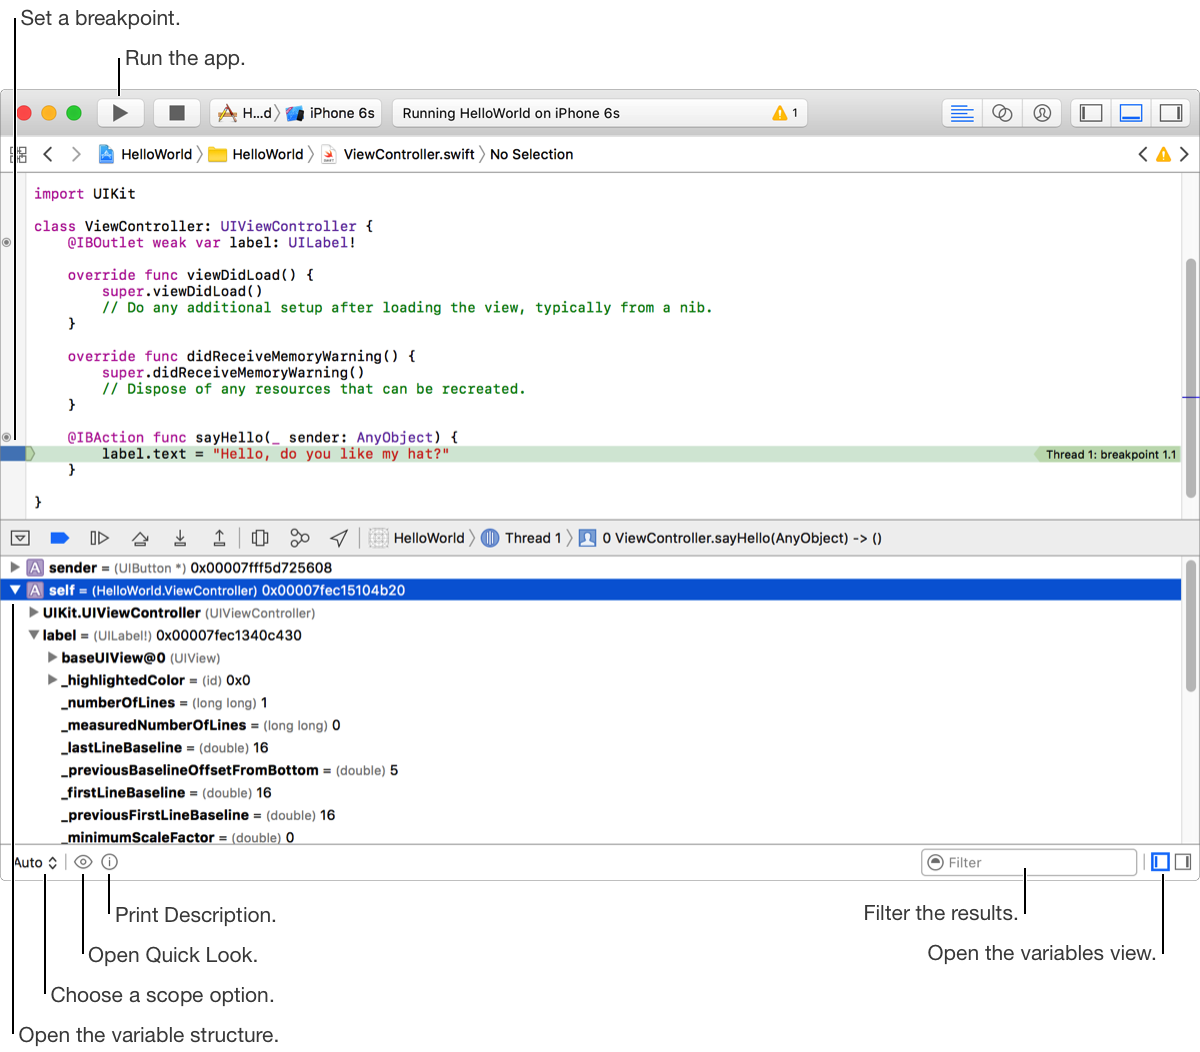
Each item in the variables view list shows the name of the variable as it appears in the code, the runtime type of the variable, the current value of the variable, and a summary for the variable, if one is available. The icon next to the variable name denotes the kind of the variable.
In the debug area, click the Pause button or wait for your app to stop at a breakpoint you previously set.
The variables that are in scope appear in the variables view of the debug area. The variables that have been deallocated appear dimmed and cannot be inspected.
Choose a scope option from the pop-up menu at the lower-left corner of the variable view.
Display recently accessed variables: Choose Auto.
Display only local variables: Choose Local.
Display all variables, registers, globals, and statics: Choose All.
To filter the results, enter text in the search field at the bottom-right corner.
To view the structure of a variable, click the disclosure triangle to the left of the variable.
To edit the summary format of a variable, Control-click the variable and choose Edit Summary Format… from the shortcut menu.
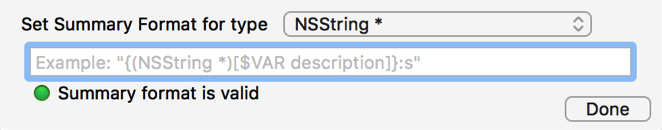
In the popover, enter a valid expression and click Done. This expression overrides the default formatter and is used to create a summary for all variables of this type.
To edit the value of a variable, Control-click the variable, choose Edit Value… from the shortcut menu, and enter a new value.
In the debug area, click the Pause button or wait for your app to stop at a breakpoint you previously set.
Click the Quick Look button or press the Space bar with a variable selected.
The Quick Look feature offers a way to view the current state of object variables in your app by displaying their contents graphically in a pop-up display.
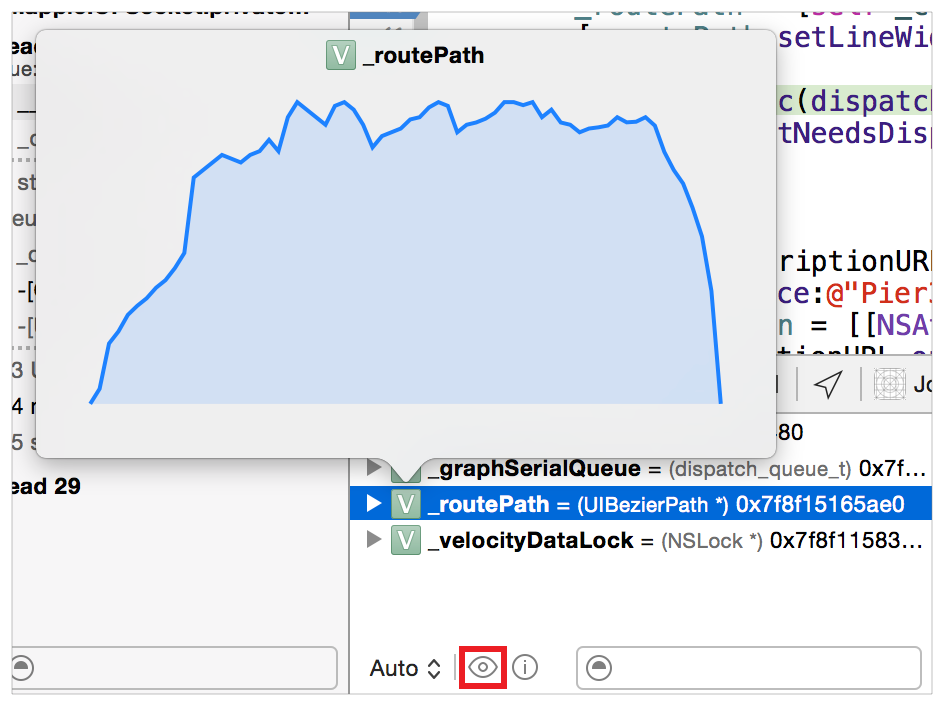
Quick Look is available for many operating system object types, including colors, images, bezier paths, and attributed strings.
Image classes NSImage, UIImage, NSImageView, UIImageView, CIContext, CIImage, CIRenderTask, NSBitmapImageRep
Cursor class NSCursor
Color classes NSColor, UIColor
Core Animation classCALayer
Bezier path classes NSBezierPath, UIBezierPath
Location classes CLLocation
View classes NSView, UIView
String class NSString
Attributed string class NSAttributedString
Data class NSData
URL class NSURL
SpriteKit classes SKSpriteNode, SKShapeNode, SKTexture, SKTextureAtlas
Other classesPDFDocument
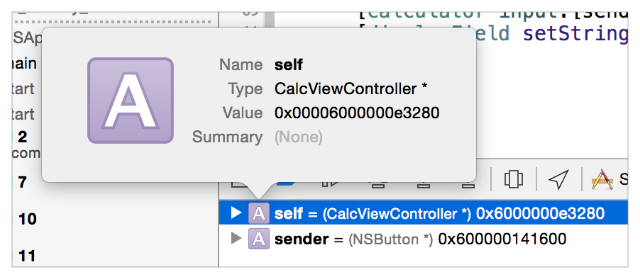
If Quick Look isn’t available for the object type of the selected variable, a default summary is displayed for that object.
In the debug area, click the Pause button or wait for your app to stop at a breakpoint you previously set.
Command-click on a variable and choose View memory of “variableName” or select the Debug > Debug Workflow > View Memory (Shift-⌘-M) menu item to open the memory console.
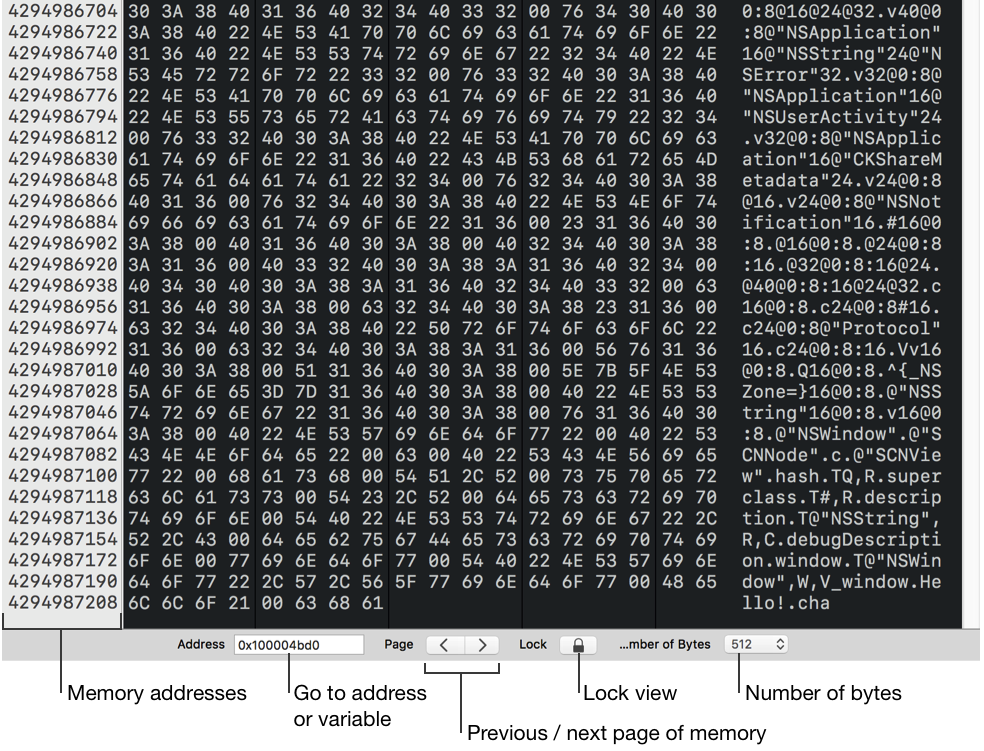
The memory console shows the hexadecimal and ASCII contents of particular memory address ranges.
Click on the memory addresses column to toggle between decimal and hexadecimal representations.
Enter a memory address or the name of a variable in scope to go to that region of memory.
Click the previous and next page controls to navigate between pages of memory.
Click the lock view button to prevent updates to the contents of memory in the current view.
Select a different number of bytes to show on a single page.