
The debug area lets you examine the threads and stacks of your running app. When you select a thread, or a stack within a thread, in the debug bar, Xcode displays the corresponding source file or assembly code in the source editor. The debug area automatically opens when you build and run your app.
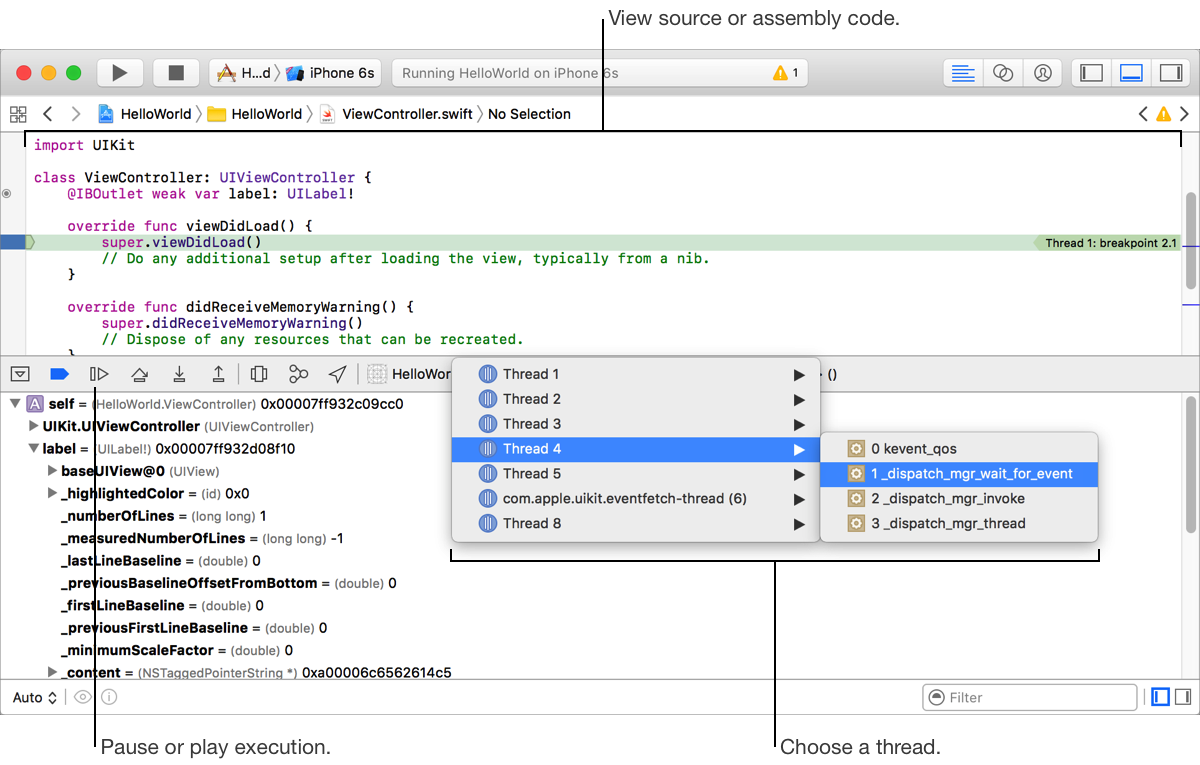
In the debug area, click the Pause button or wait for your app to stop at a breakpoint.
In the debug bar, choose a thread from the pop-up menu.
In the source editor, view the corresponding source or assembly code.