
After your bot runs integrations, you can view the results in the Report navigator. You can view bot summary and details or view integration details.
To open the Report navigator, click the Report navigator button (![]() ) in the navigator area of the main window.
) in the navigator area of the main window.
In the Report navigator, click By Group.
Status information is gathered for each of the bots.
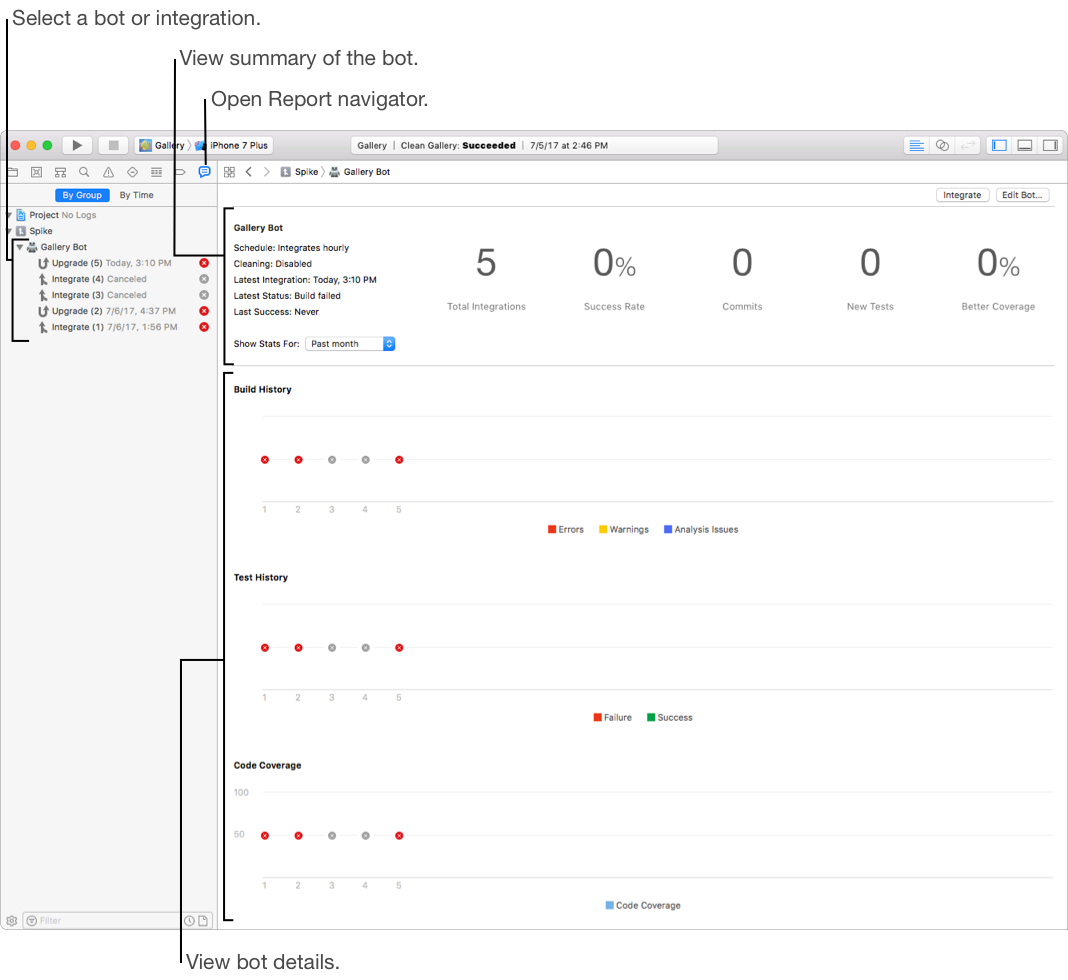
To view the bots configured for a server, click the disclosure triangle next to the Xcode Server name.
Select the bot whose integrations you want to view.
The detail area on the right displays a summary of the integrations the bot performed, along with any commits, build errors and warnings, static analysis issues, and test failures. Below the summary details are provided in these areas:
Build History: Displays a bar graph depicting the errors, warnings, and static analysis issues the bot encountered when building. Click a bar to display a tally of the issues.
Test History: Shows the number of successful and failed test cases the bot performed. Click a bar to display a tally of the passed and failed tests.
Code Coverage: Shows statistics about your code.
Alternatively, to view a bot in your browser, in the left column, Control-click the bot and choose View Bot in Browser.
In the Report navigator, click the disclosure triangle next to the Mac running Xcode Server to reveal its bots.
Click the disclosure triangle next to the bot whose integrations you want to view.
To the right of each integration listed in the Report navigator, Xcode displays an icon that indicates whether there was an error, a warning, a static analysis issue, or an integration failure. At a glance, this allows you to quickly assess the status of your bot’s integrations.
Select a specific integration.
The Summary pane displays the following information:
A summary of the integration’s results
The number of errors, warnings, static analysis issues, and test-case failures encountered
If applicable, lists of new issues, resolved issues, and build service issues
If applicable, a build Results area, allowing you to download an archive of the product
A Device Testing Summary, which lists any devices tested and their pass or fail status
If a bot is actively performing the selected integration, the progress instead of the results of the integration appear.
In the toolbar, click Tests to view a list of tests and their pass or fail status for the integration.
If you have multiple test devices, click the disclosure triangle to the left of a test to view the pass or fail status for each individual device.
If your project is configured to conduct performance testing, you can view performance test results and specify a baseline. Specifying a baseline for a performance test adds value to the test and causes the integration to fail if the test falls outside of a certain threshold below the baseline.
In the toolbar, click Commits to view details about the new commits included in the integration. (Commits may be viewed for all committers, or you may select an individual committer.)
By clicking the “Show modified files” button, you can view the files that are part of the commit in the Xcode version editor, allowing you to identify the specific code changes that were made.
In the toolbar, click Logs to view the logs of the actions that occurred during the integration. Use filters to display all log messages, issues, or errors, and use the search field to find specific messages.
Alternatively, to view an integration in your browser, in the left column, Control-click the bot and choose View Integration in Browser.