
Use the Report navigator to browse the reports and logs that Xcode generates during your development process, such as task reports, debugging session logs, and bot reports. Select one to open it in the editor area.
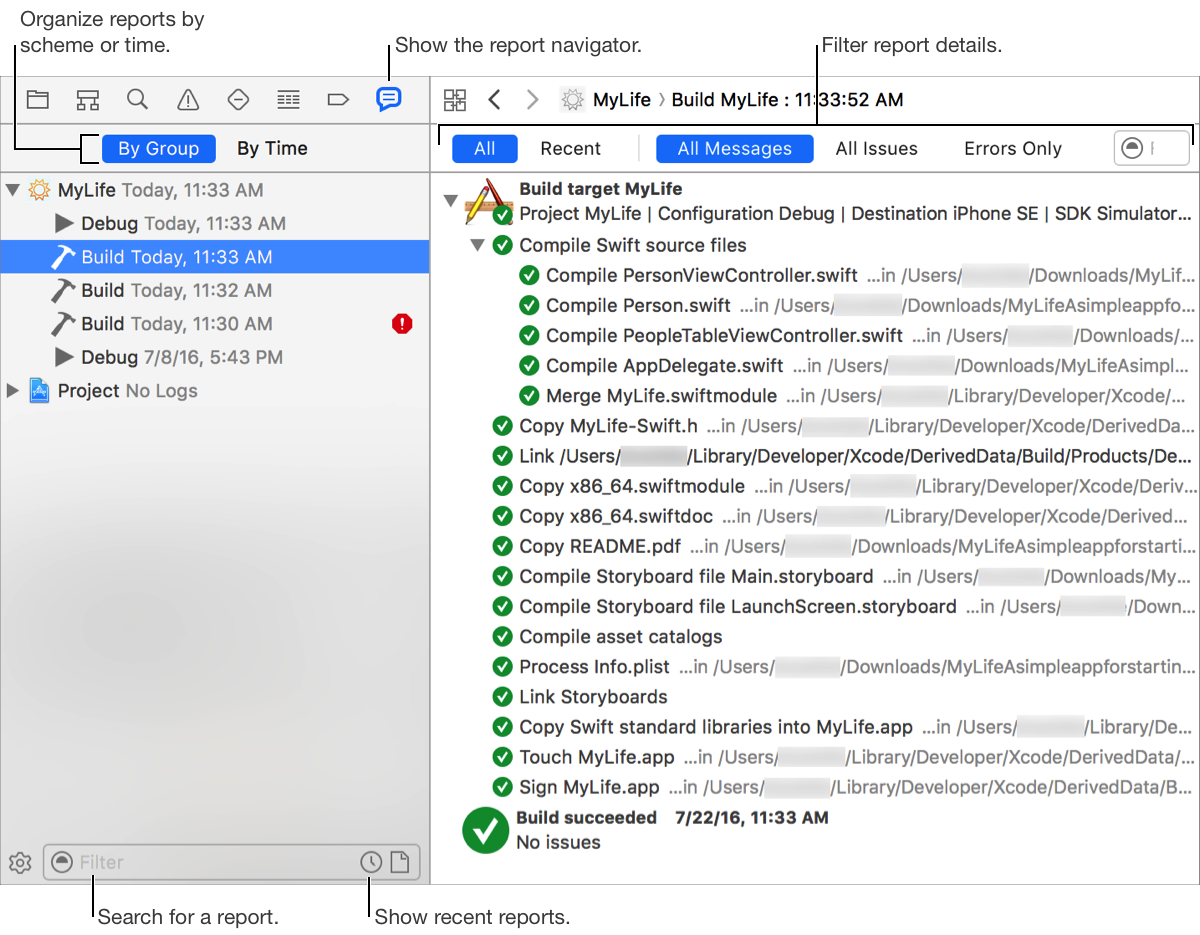
Group reports by scheme and bot: Click By Group in the sorting bar at the top of the Report navigator.
List reports by time: Click By Time in the sorting bar at the top of the Report navigator.
Show recent reports only: Click the Recent Reports button (![]() ) in the filter bar at the bottom of the Report navigator.
) in the filter bar at the bottom of the Report navigator.
Filter the messages in a task report: Click a filter button (All, Recent, All Messages, All Issues, or Errors Only) or enter some text in the filter field at the top of the editor area.
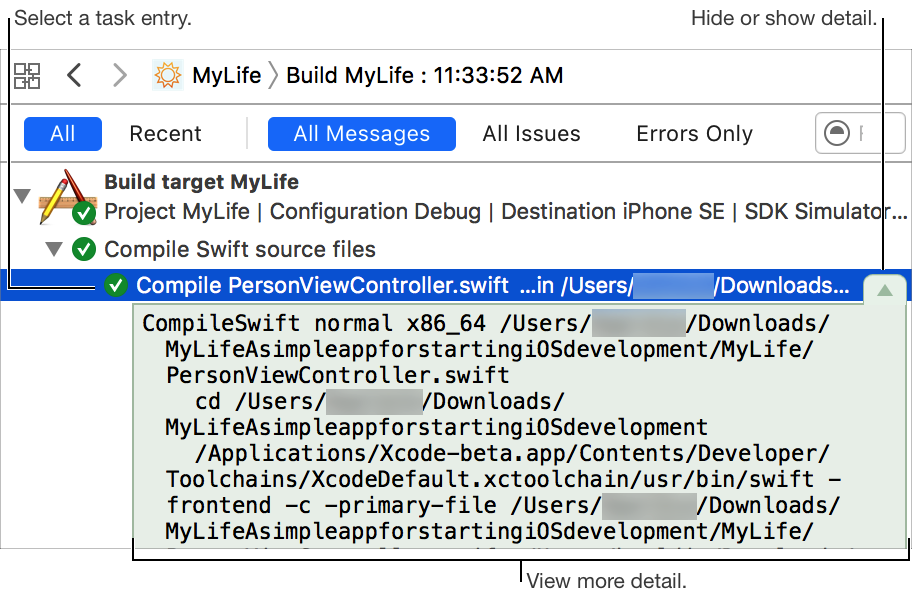
See more detail for a task report entry: Click the Open Transcript button (![]() ) near the right edge of the entry. A log of all of the activities performed for the operation is displayed. To hide the transcript, click the Close Transcript button (
) near the right edge of the entry. A log of all of the activities performed for the operation is displayed. To hide the transcript, click the Close Transcript button (![]() ).
).
See more detail about a task report error or warning: Option-click the task report entry for the error or warning. The editor area shows all detail for the task and scrolls to the error or warning.
See the source of a task report error or warning in editor: Double-click the task report entry for the error or warning. The editor opens and scrolls to the error or warning.
See the source of a task report error or warning in the assistant editor: Option-double-click the task report entry for the error or warning. The assistant editor opens and scrolls to the error or warning.