
After recording a trace, Instruments displays an overview of the results in the timeline and detailed results for the selected instruments in the detail pane. These results vary from instrument to instrument. They may include things like a summary, a call tree, and a sample list. Often, a lot of data is presented here, and navigating it can be time consuming. To help get you to the right information quickly, Instruments often (again, it depends on the instrument) allows you to make adjustments to, and to filter down the information displayed in both the timeline and the detail pane.
Move the pointer over an instrument icon in the timeline. If that instrument supports different display configurations an indicator appears next to the icon.
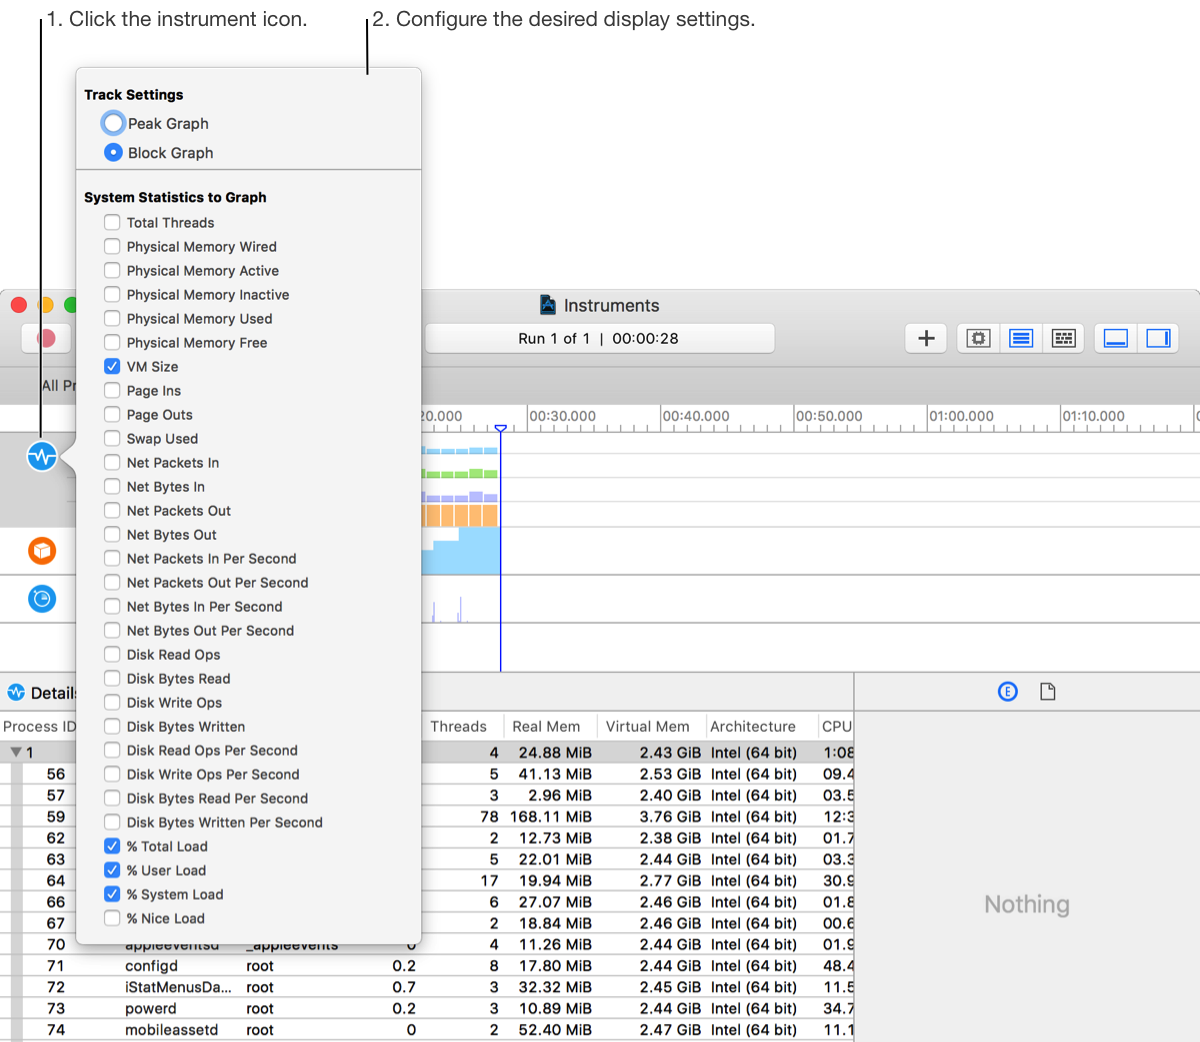
Click the icon to show the display configuration popover.
Select the desired display configuration. The timeline updates as configuration options are chosen.
Click outside of the popover to close it.
Use the controls in the filter and configuration bar at the bottom of the detail pane to configure the display settings. The types of controls and the configuration choices vary from instrument to instrument.
