
After you select a crash or energy report, you can view the sampling of logs in the report and go to the source code where the event occurred in the detail area.
In the Crashes organizer, the detail area shows the crash logs (one at a time) for the selected crash report. A crash log contains a complete backtrace of the process at the time the app stopped. A crash log groups the stack frames by threads and the stack frame where the crash likely occurred is highlighted.
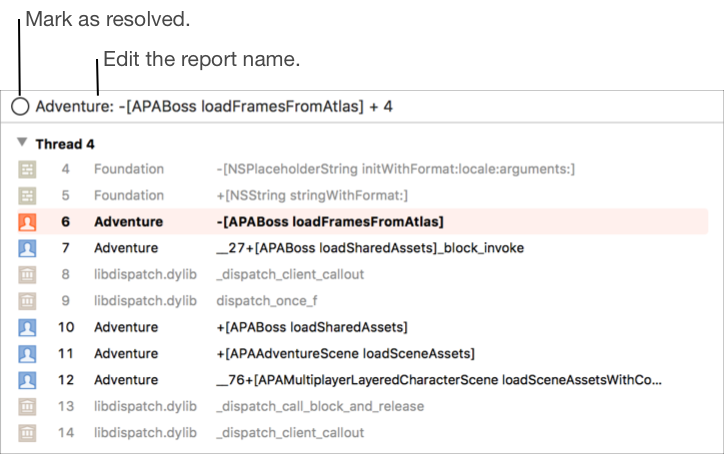
In both organizers, stack frames in your app are denoted with a person icon (![]() ) on the left and appear in black text. Stack frames in frameworks and system code are denoted with other unique icons and appear in gray text.
) on the left and appear in black text. Stack frames in frameworks and system code are denoted with other unique icons and appear in gray text.
In the Energy organizer, reports are similar but show the percentage a frame appears in the total samples. An energy log contains a sampling of CPU usage taken over a period of time. You can navigate the backtraces in the historical tree structure to locate where your app is spending the most time.

Change the name of a report: Place the insertion point in the header, then edit the text.
Mark a report as resolved: Click the circle (![]() ) to the left of the report name in the header.
) to the left of the report name in the header.
Go to the source code for a stack frame: Hover the pointer over the stack frame, then click the arrow that appears.
Go to the source code where the event occurred: Hover the pointer over the stack frame that is highlighted, then click the arrow that appears.
The Debug navigator opens to the stack frame that you hovered over. For a crash report, the backtrace for every thread is loaded into the Debug navigator and you can navigate the code similar to debugging a running app. For an energy report, the heaviest backtrace, that includes the stack frame you hovered over, is loaded.
Important: For best results, have the same project that you archived and distributed open in Xcode. If your code changed since the time when the report was generated, Xcode may be unable to correctly navigate your code from the log loaded in the Debug navigator.
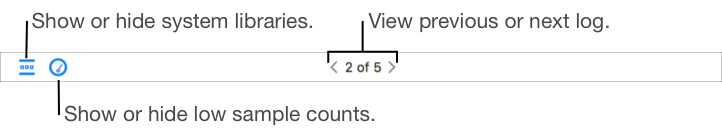
View the previous or next log: In the footer, click the page arrows (< or >), or click the page count and choose a page from the pop-up menu.
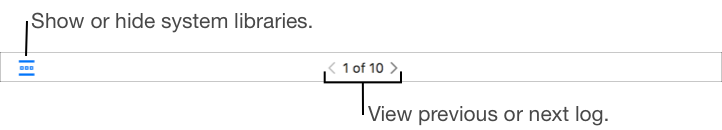
Show or hide system libraries: In the lower-left corner in the footer, click the filter icon (![]() ).
).
Show or hide low sample counts: Click the gauge icon (![]() ).
).
Filters stack frames where the sample count is less than 5% of the total samples taken. Also, hides any frames that are less than 10% of the sum of the samples of the frame’s siblings including itself.
Show a log in Finder: Control-click a log, then choose “Show in Finder.”