
Use the Energy Impact gauge in the Debug navigator to monitor your app’s energy usage. This gauge only appears if you run your app on a real device.
For iOS apps, the Energy Report appears as:
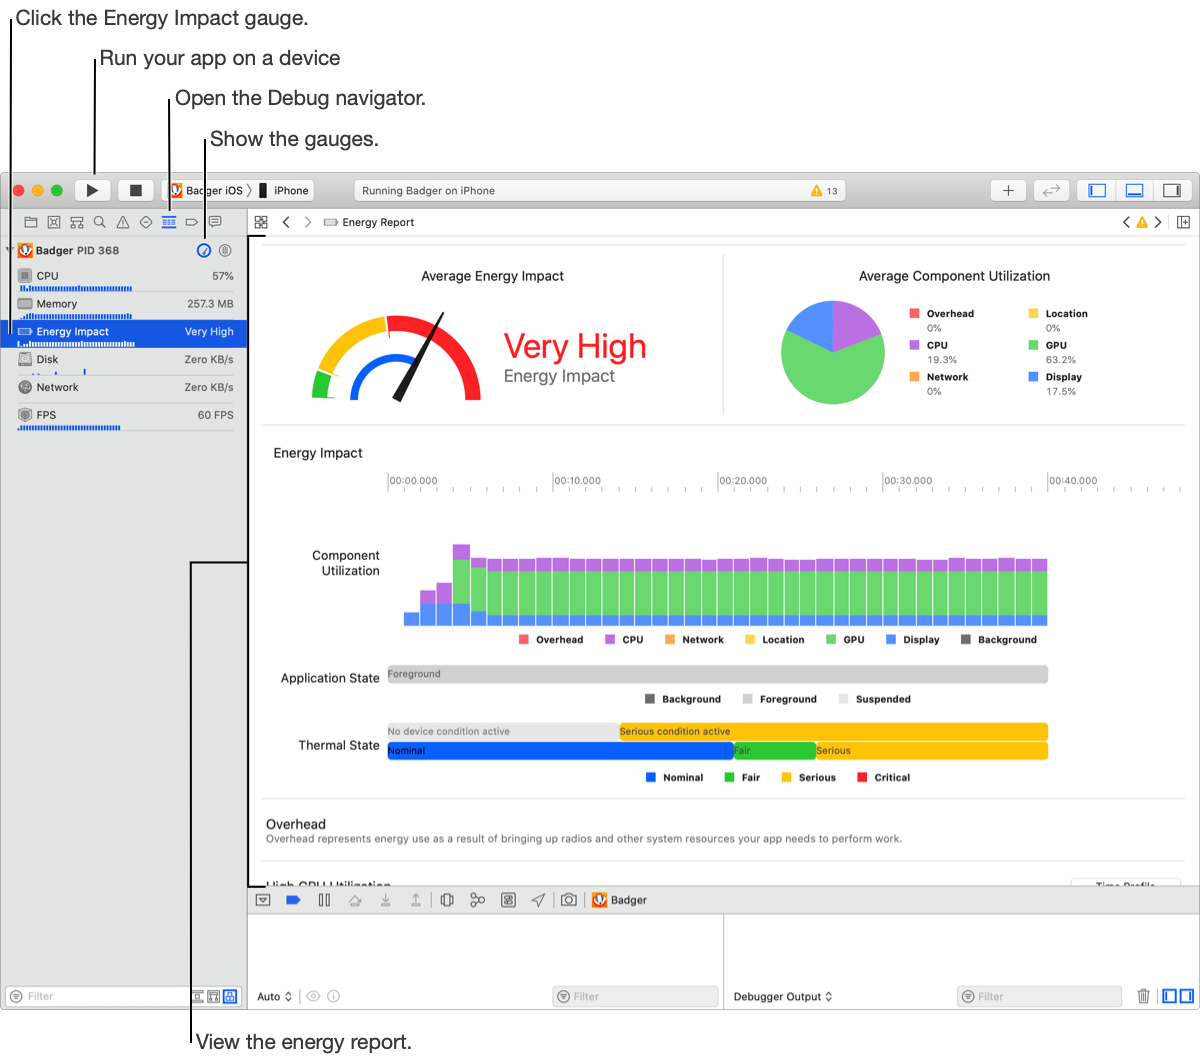
Run your app in the debugger on a device.
For iOS apps, choose a real, not a simulated, device from the scheme menu. Go to Signing & Capabilities workflow, then go to Run an app on a device.
In the navigator area, click the Debug navigator button (![]() ).
).
The debug gauges that appear in the Navigator show the activity for the last 10 seconds. (If necessary, click the Show Debug Gauges button (![]() ) to reveal the gauges.)
) to reveal the gauges.)
To see the energy usage details, click the Energy Impact gauge.
The Energy Report appears in the editor area.
Under Average Energy Impact (for macOS apps, Utilization), view the overall score of your app.
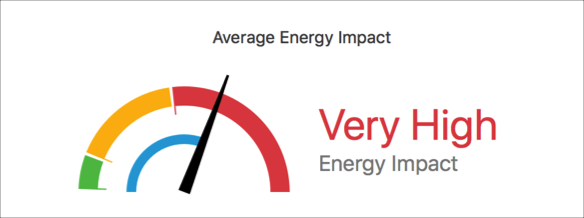
The meaning of the colors on the dial are:
Green: Low average energy.
Yellow: High average energy.
Red: Very high average energy.
For iOS apps, under Average Component Utilization, view the percentages for each area of usage.
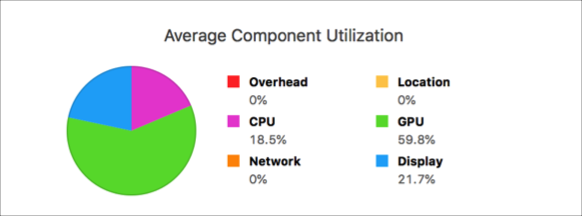
The areas of usage are:
Overhead
CPU
Network
Location
GPU
Display (iPhone X only)
Under Energy Impact, observe the energy usage of your app interactively over time.
The metrics change in the gauge as you test common and app-specific flows. For example, launch your app, put it in the background, and then perform other user actions.
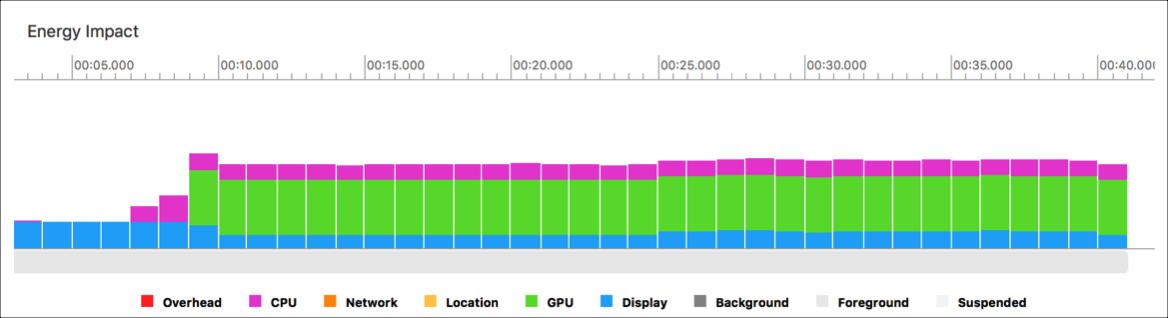
The bar chart shows the energy used in the different areas and whether the app is in these states:
Foreground
Background
Suspended
To get hints on how to reduce energy usage, scroll to the bottom of the report.
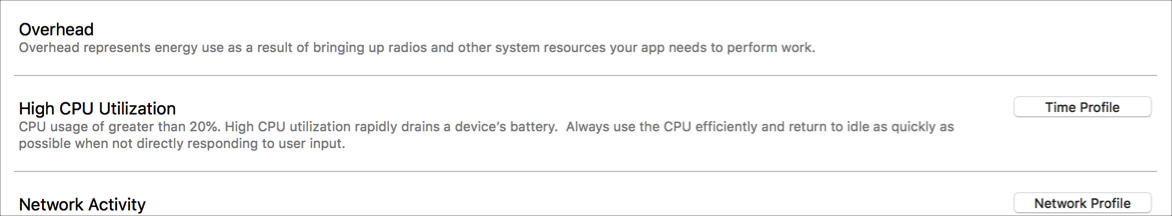
To further analyze your app in Instruments, click a button that appears to the right of a hint.