
After you select a crash or energy report in the organizer, you can view and add metadata—such as the name, version, build, and notes—as well as other metrics in the inspector on the right. Changes you make to metadata are stored locally.
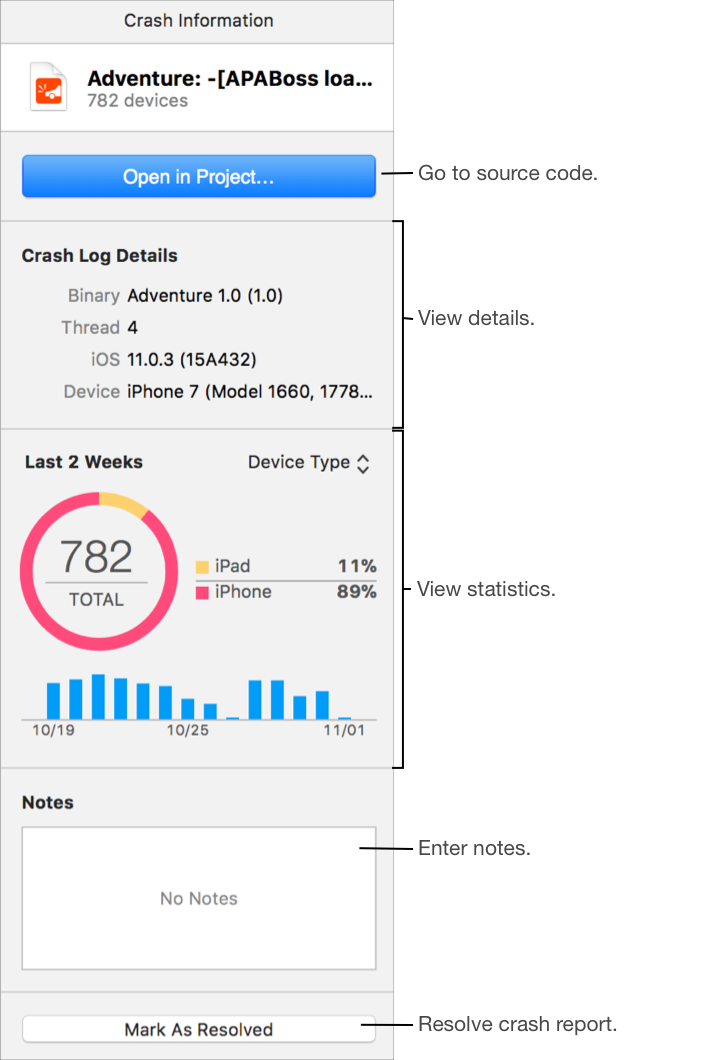
Go to the source code where the event occurred: In the inspector, click “Open in Project” and in the sheet that appears, open a project.
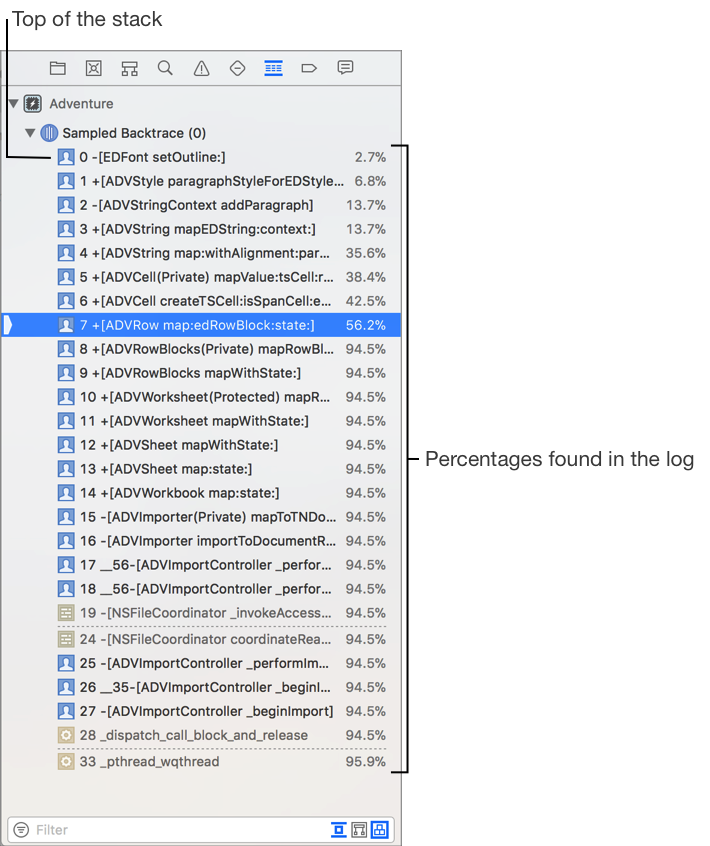
For a crash report, the Debug navigator opens to the stack frame where the crash occurred. The full backtrace for every thread is loaded into the Debug navigator and you can navigate the code similar to debugging a running app. For an energy report, the Debug navigator opens to the backtrace that contains the most samples without identifying threads. The top of the stack is shown first. The navigator also shows the percentages found in the log.
Add notes about a report: In the inspector, enter text in the Notes field at the bottom.
Mark the report as resolved: In the inspector, click “Mark as Resolved.” Alternatively, click the circle (![]() ) to the left of the title in the header of the detail area.
) to the left of the title in the header of the detail area.