You can locate the source of a drawing problem most quickly by initiating a debug session for a custom view directly in Interface Builder.
In Interface Builder, select the custom view in the canvas or outline view.
Choose View > Assistant Editor > Show Assistant Editor, and use the assistant jump bar to navigate to the implementation file for your custom view.
Add a breakpoint to the line in your source code where you want your app to pause.
Choose Editor > Debug Selected Views.
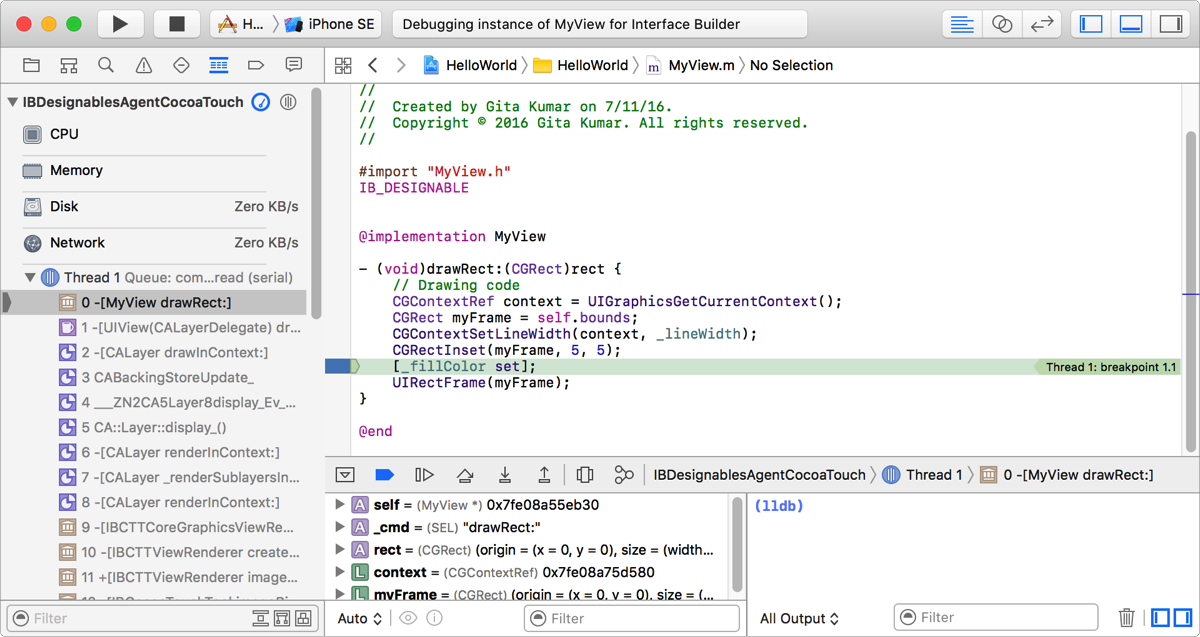
Interface Builder executes the code for the custom view until it pauses at the breakpoint. The debug area opens at the bottom of the main window, and the Debug navigator opens to display a stack trace. If your custom view crashes or exhibits poor performance, an error appears in the Issue navigator.