Switch rows and columns as data series
Select the chart, then click Edit Chart Data.
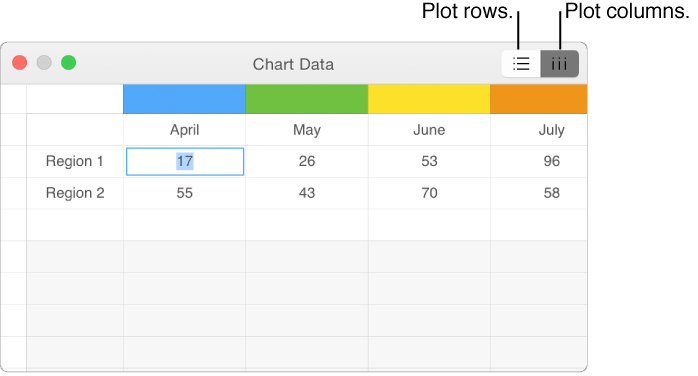
Click the row or column button in the top-right corner of the Chart Data window.
Close the Chart Data Editor when you’re done.
You can modify a chart’s data references at any time in the Chart Data Editor.
Select the chart, click Edit Chart Data, then do any of the following:
Add a data series: Click a cell in a new row or column, then enter your data.
Delete a data series: Click the colored bar for the row or column you want to delete, click the arrow that appears, then click Delete Column or Delete Row (depending on whether you plotted rows or columns as data series).
Reorder data series: Drag the colored bar to reorder the chart data series.
Add a currency symbol or other formatting: Click the Series tab at the top of the sidebar on the right, then use the controls in the Series tab.
Edit value labels and format numbers: Click the Series tab at the top of the sidebar on the right, click the disclosure triangle next to Value Labels, then select the Values checkbox. Click the pop-up menu to choose the axis you want to format, then use the controls in the Value Data Format section to make your settings.
Close the Chart Data window to return to the chart.
Select the chart, then click Edit Chart Data.
Click the row or column button in the top-right corner of the Chart Data window.
Close the Chart Data Editor when you’re done.
Sharing the x-axis means plotting a single kind of value along the x-axis, while allowing for multiple kinds of values plotted along the y-axis. By default, the x-axis values are shared among multiple sets of y-axis values in some types of charts.
Select the chart, then click Edit Chart Data.
Click ![]() , then select (or deselect) Share X Values.
, then select (or deselect) Share X Values.
Close the Chart Data Editor when you’re done.
If you can’t edit a chart, you may need to unlock it.