
Create a chart
Tap
 , then tap
  .
.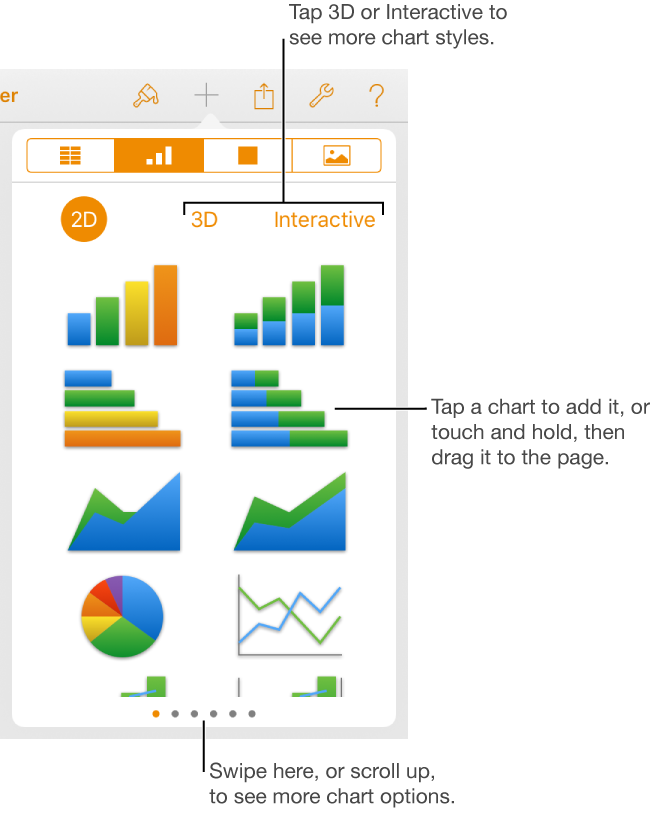
Tap 2D, 3D, or Interactive to see options for the type of chart you want to add, then tap a chart to add it.
Swipe left or right to see more options for each type of chart.
Drag the chart to where you want it.
If you add a 3D chart, you see a rotation control at its center. Drag this control at any time to adjust the chart’s orientation.
To add your data, tap the chart, tap Edit Data, then do any of the following:
Enter data: Tap placeholder text, then enter your own data.
Enter dates, times, and durations: Tap
 , turn on Full Keyboard, then enter your data.
 Change whether rows or columns are plotted as a data series: Tap
in the toolbar, then tap an option.
Tap Done in the toolbar.