Add or delete a chart

You can display your data using 2D, 3D, and interactive charts.

There are two ways to create a chart. You can add a blank chart, then select the table cells with the data you want to use. Or, you can select table cells first, then create a chart that displays the data. Either way, when you change the data in the table, the chart updates automatically.

You can import a spreadsheet with charts from Microsoft Excel or Numbers for Mac. The imported spreadsheet might be somewhat different from the original. For example, if an imported spreadsheet has a chart with trendlines or error bars, you won’t be able to edit them or add new ones.

Tip: To see examples of different chart types, explore the Charting Basics template in Numbers. In the spreadsheet manager, tap Create Spreadsheet, then tap Charting Basics in the Basic template category. Each sheet explains a different type of chart.

Create a chart then add data

  1. Tap Add button, then tap Chart button.

  2. Tap 2D, 3D, or Interactive, swipe to see more options for each type of chart, then tap a chart to add it.

    The chart menu showing 2D charts

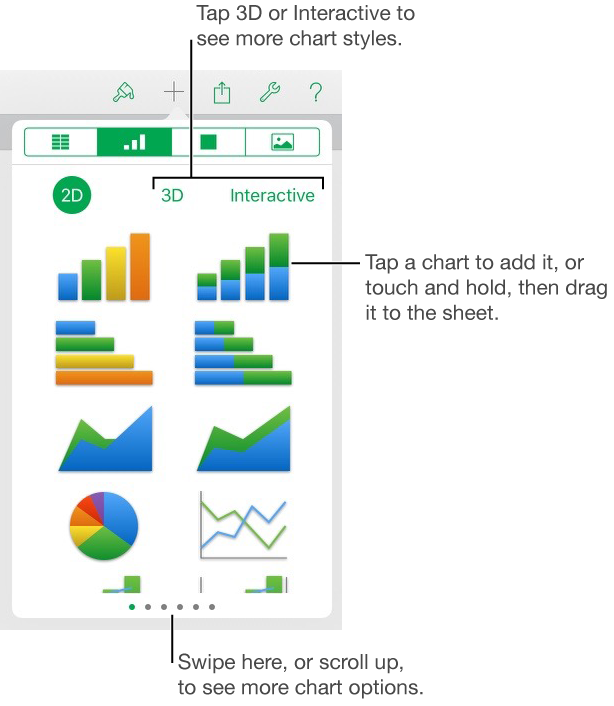
    Note: The stacked bar, column, and area charts show two or more data series stacked together.

  3. Drag the chart to where you want it on the sheet.

  4. Tap the chart, then select the table cells with the data you want to use.

    To add data from an entire row or column, tap the number or letter for that row or column.

    You can select cells in one or more tables, including tables on different sheets. While you’re editing a chart’s data references, an icon appears on the tab for any sheet that contains data used in the chart.

  5. To change whether rows or columns are plotted as data series, tap The gear button for determining how chart data is plotted in the toolbar, then tap an option.

  6. Tap Done in the toolbar.

You can change the data reflected in the chart at any time. To learn how, see Modify chart data references.

Use existing data to create a chart

  1. Select the table cells with the data you want to use, or to add data from an entire row or column, tap the table, then tap the number or letter for that row or column.

  2. Tap Create Chart, then tap 2D, 3D, or Interactive.

    Swipe to see more style options for each type of chart.

  3. Tap a chart to add it, then drag the chart to where you want it on the sheet.

  4. To change whether rows or columns are plotted as data series, tap the chart, tap Edit References, tap Gear button for determining how chart data is plotted in the toolbar, then tap an option.

  5. Tap Done in the toolbar.

You can adjust the data reflected in the chart at any time. To learn how, see Modify chart data references.

Delete a chart

Deleting the table data you used to create the chart doesn’t delete the chart; it simply clears the chart of all data.

See also
Create scatter charts and bubble charts
Create an interactive chart
Modify chart data references
Adjust chart markings and labels
Position and align objects