
The Xcode debug navigator includes several gauges that monitor an app as you test and debug it. These gauges track a variety of factors, including CPU usage, memory, and energy impact, and can alert you to potential problems that may impact performance, power consumption, and more. If you identify a trend you wish to investigate further while testing your app, you can transition monitoring over to Instruments for more detailed analysis.
Open an app project in Xcode and run it.
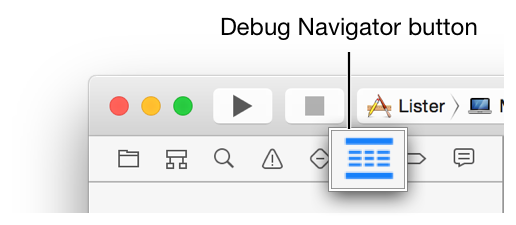
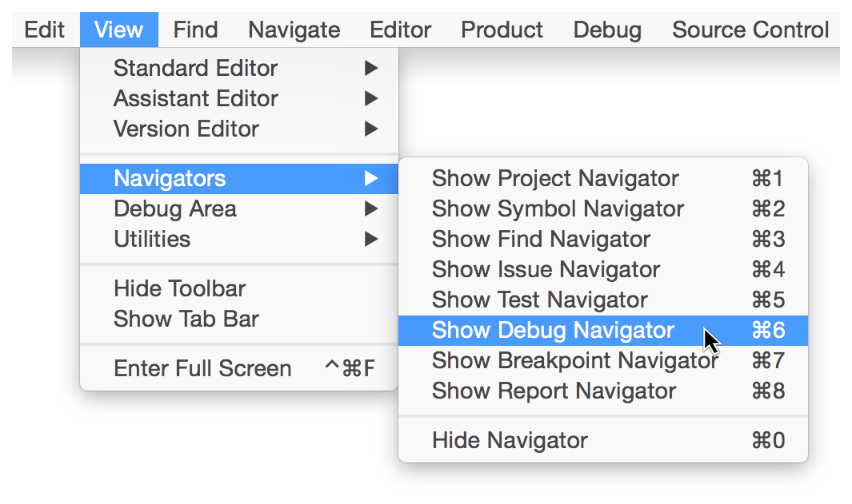
While your app is running, display the debug navigator by doing one of the following:
Click the Debug Navigator button in the navigator selector bar.
Choose View > Navigators > Show Debug Navigator (or press Command-6).
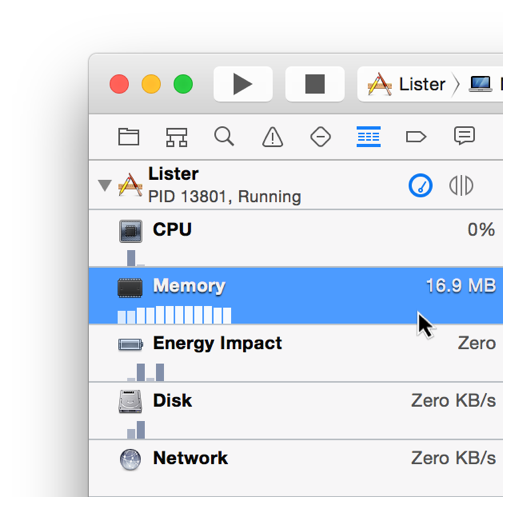
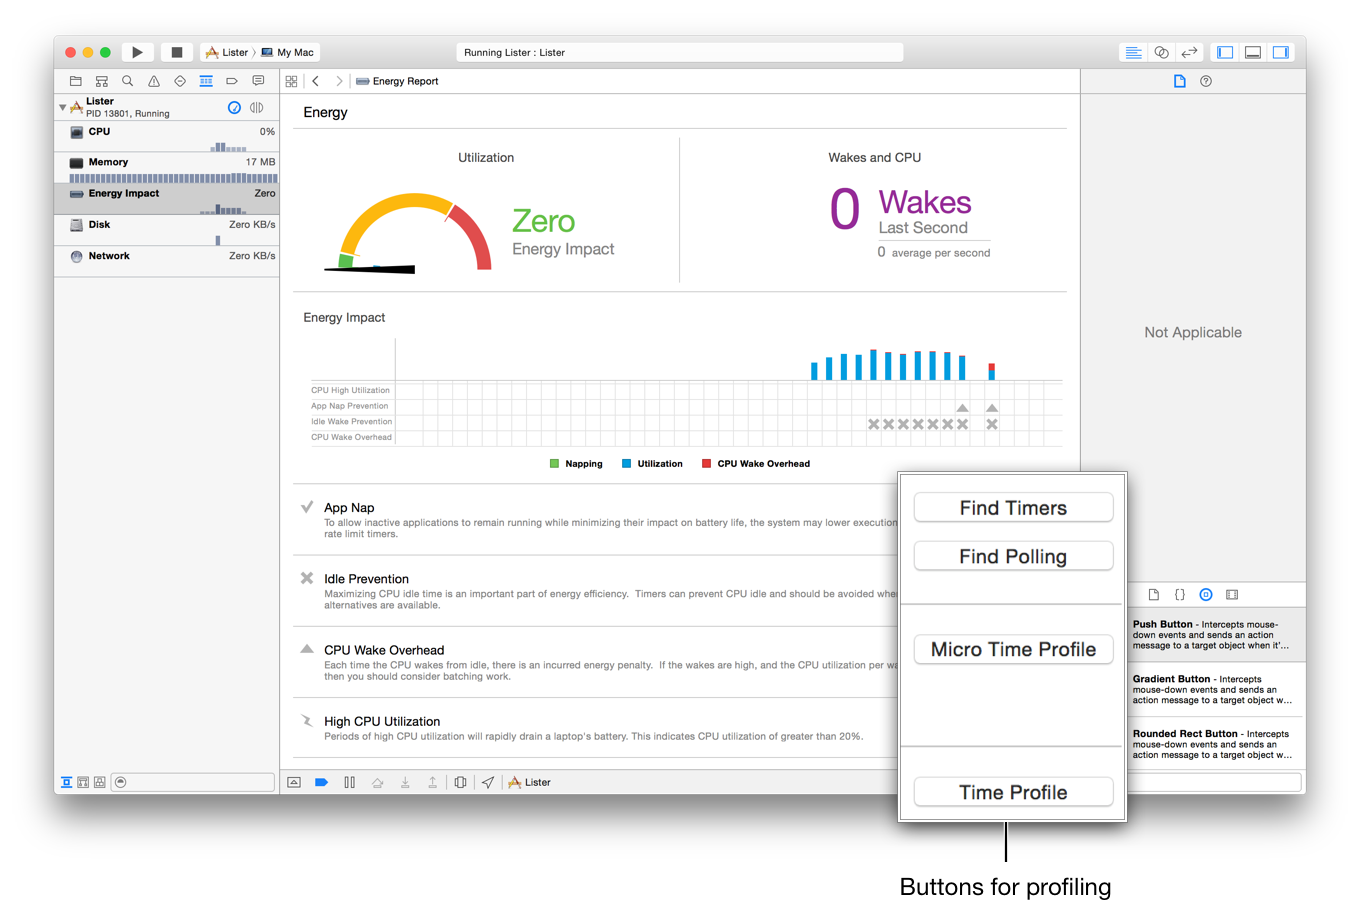
Click the desired gauge in the debug navigator.
Click the gauge’s Profile in Instruments button in the main editor.
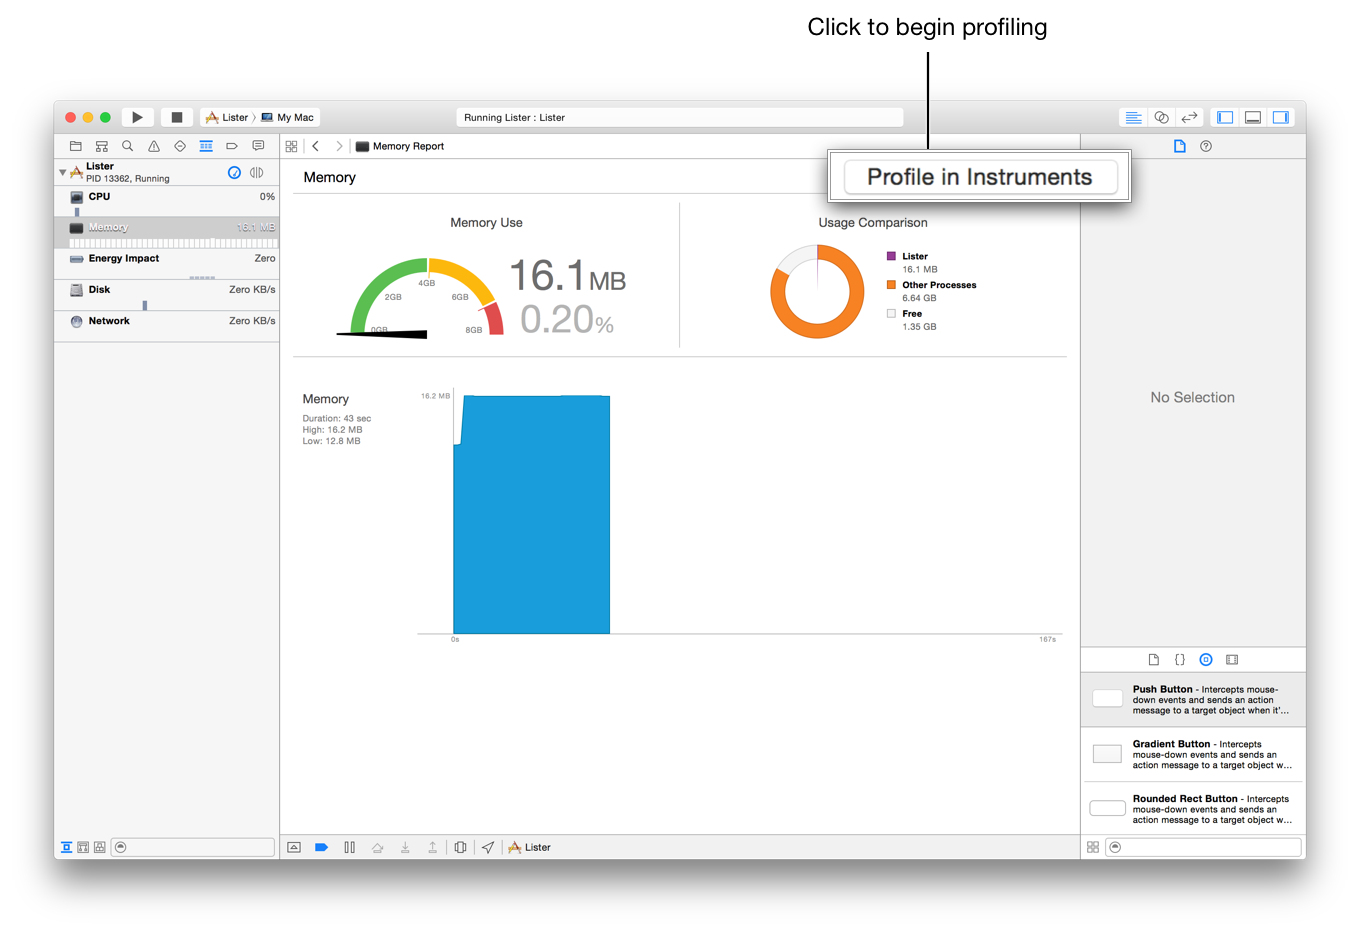
Note: Not every Xcode gauge has a Profile in Instruments button. The Energy Impact gauge, for example, includes several buttons for initiating different types of profiling sessions in Instruments.
When prompted, select whether to transfer the currently running instance of your app over to Instruments or stop the app and start a new instance of it with Instruments.
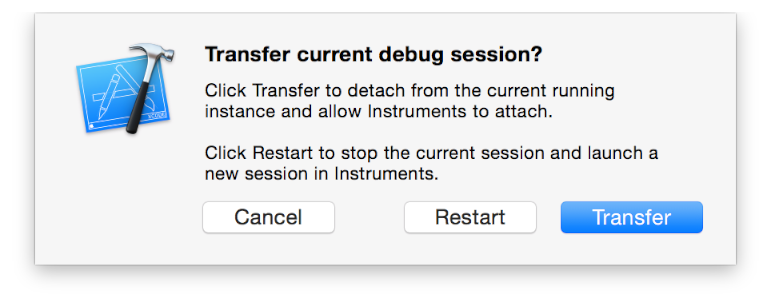
In both cases, note that Xcode stops profiling your app, launches Instruments, and initiates profiling. If you chose to transfer the session, Instruments begins profiling your app in its current state.