
Use the instruments command-line tool (see instruments(1) Mac OS X Developer Tools Manual Page) to profile an app using a specified template without launching Instruments. Data gathered during profiling is saved in a .trace file into a specified directory. After profiling is complete, you can open the recorded data file with Instruments to see a visual representation of the data.
Open Terminal, in /Applications/Utilities.
Enter an instruments command to collect data.
For example, the following command profiles an app with the Allocations template and saves the results to the desktop in a .trace file.
instruments -t "Allocations" -D ~/Desktop/YourTraceFileName.trace PathToYourAppOpen Instruments, and choose File > Open.
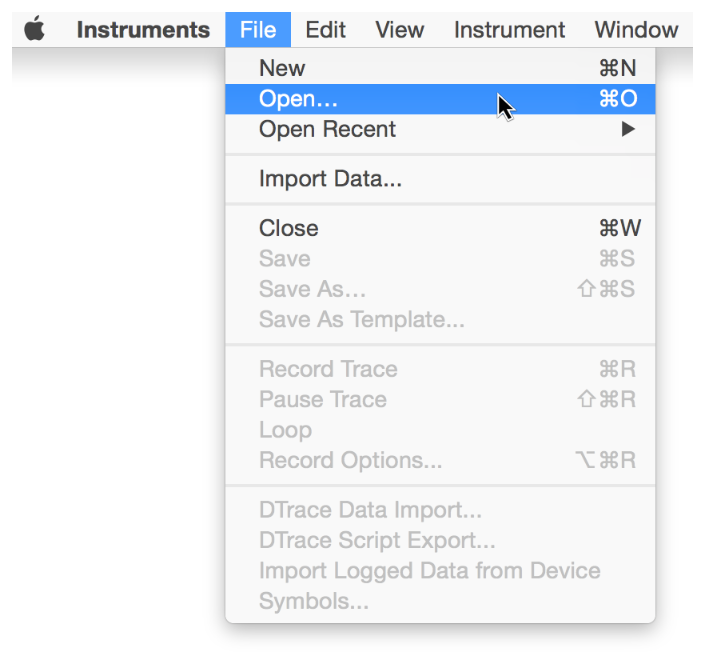
Find your saved .trace file, and click Open.
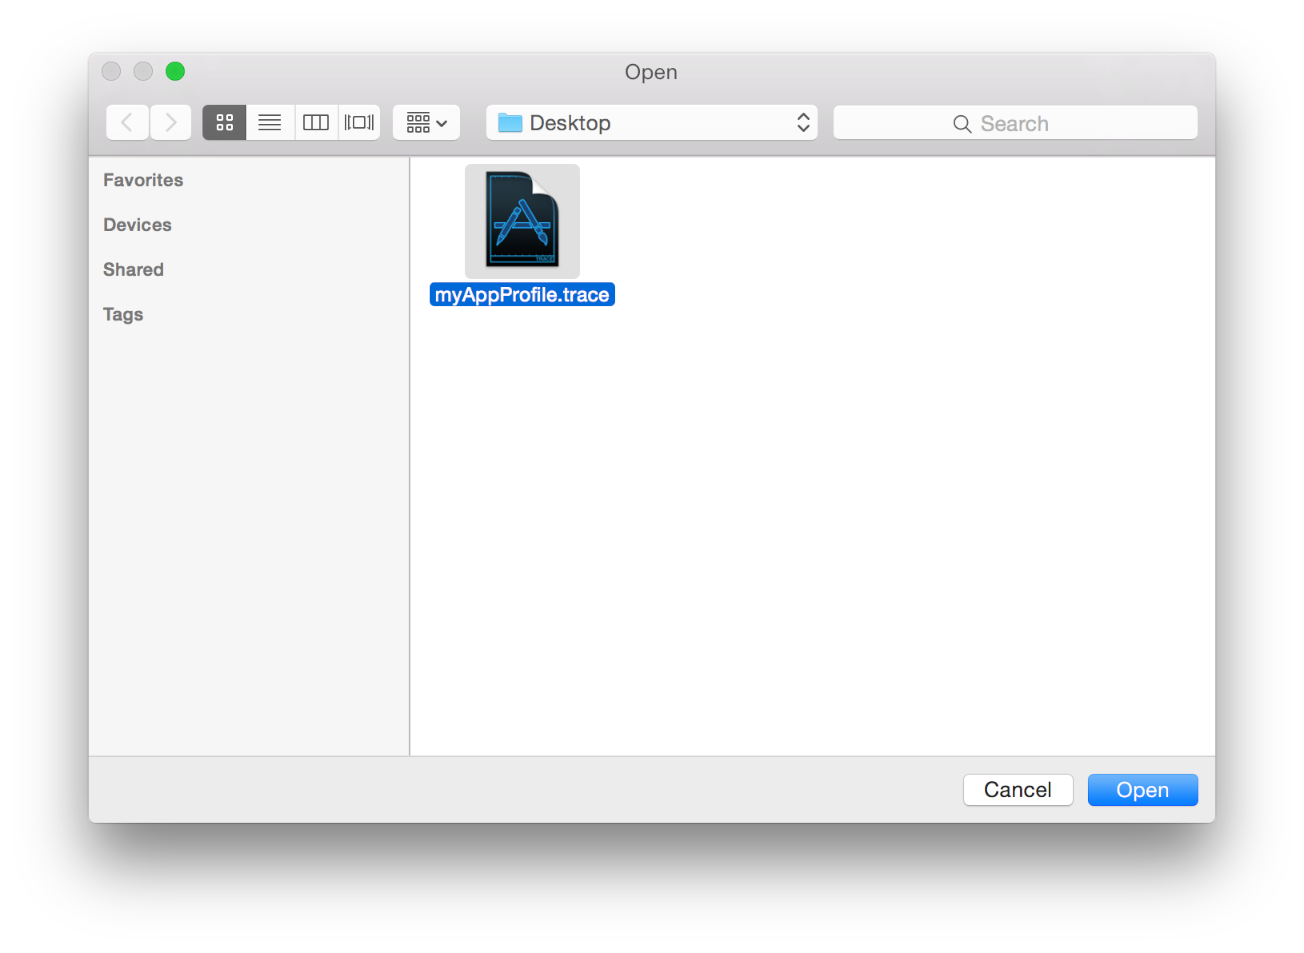
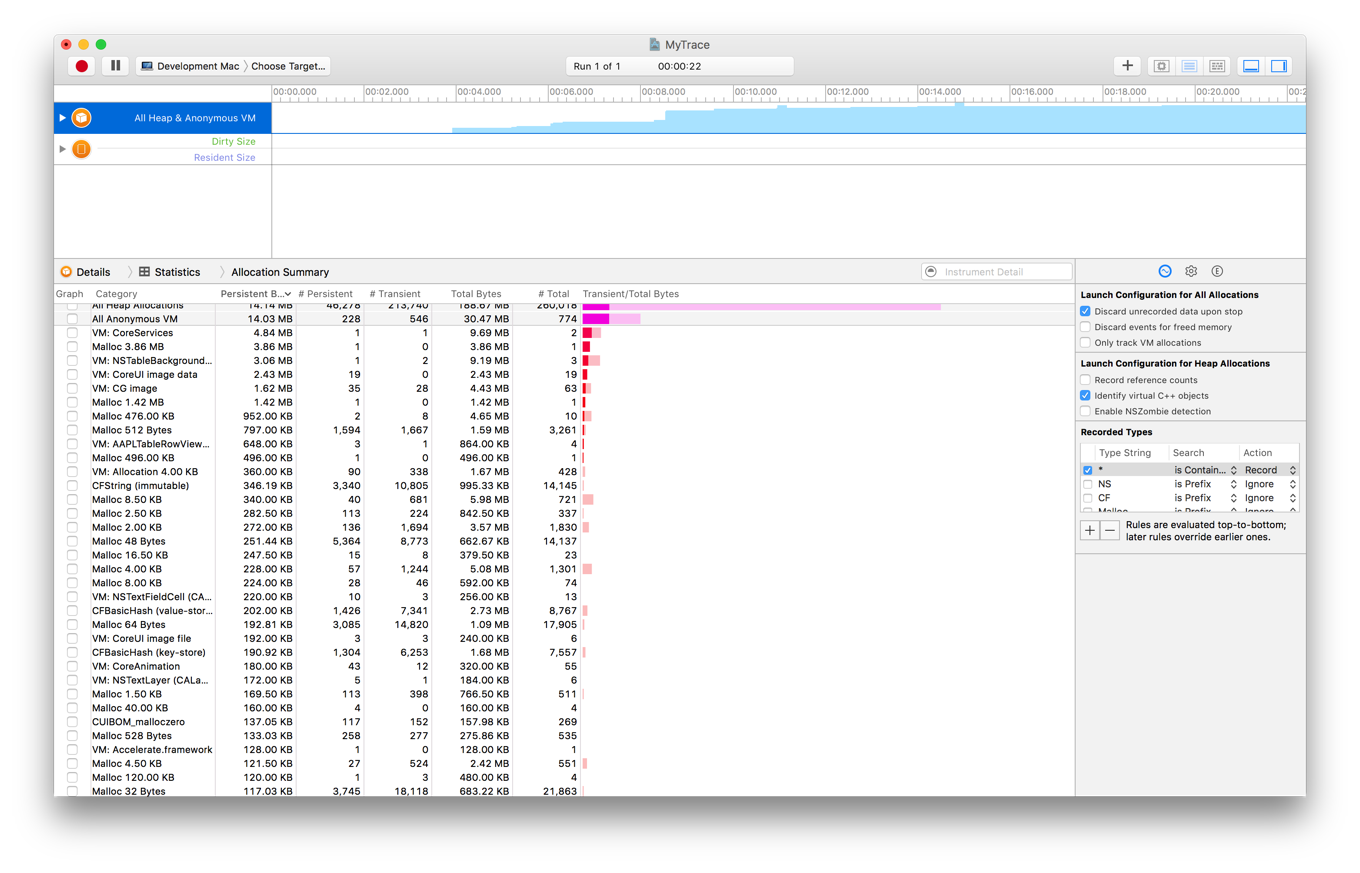
After opening the saved file, Instruments automatically adds the associated instruments to a trace document and populates them with the collected data. You can view and analyze the data in order to locate any issues with your app.
instruments options
instruments provides the following set of configuration options for defining what data to collect.
Configuration option | Description | ||||||||||
|---|---|---|---|---|---|---|---|---|---|---|---|
| The name or path of the profiling template to use when analyzing your app. | ||||||||||
| Returns a list of all installed profiling templates. | ||||||||||
| The path where the .trace document should be saved. If the file already exists, the newly recorded data is appended to it as a new run. | ||||||||||
| The amount of time to record, in milliseconds, before terminating. If not provided, recording occurs indefinitely, until the app is manually terminated. | ||||||||||
| The index of the instrument to use for recording. | ||||||||||
| The process ID of the app to be recorded. | ||||||||||
| The path of the app to be recorded. | ||||||||||
| The ID of the device to target. | ||||||||||
| An environment variable to be applied while profiling. | ||||||||||
| A command-line argument to be passed to the app being profiled. Multiple arguments may be specified, if desired. | ||||||||||
| Enables verbose logging while profiling. | ||||||||||