
Use the iprofiler command-line tool (see iprofiler(1) Mac OS X Developer Tools Manual Page) to measure an app’s performance without launching Instruments. After collecting performance data, import it into Instruments in order to see a visual representation of the data. Data collected by iprofiler is saved in a .dtps bundle that can be opened by Instruments.
Open Terminal, in /Applications/Utilities.
Enter an iprofiler command to collect data.
For example, the following command performs an Activity Monitor trace on your app for 5 seconds and saves the results to the desktop in a .dtps file.
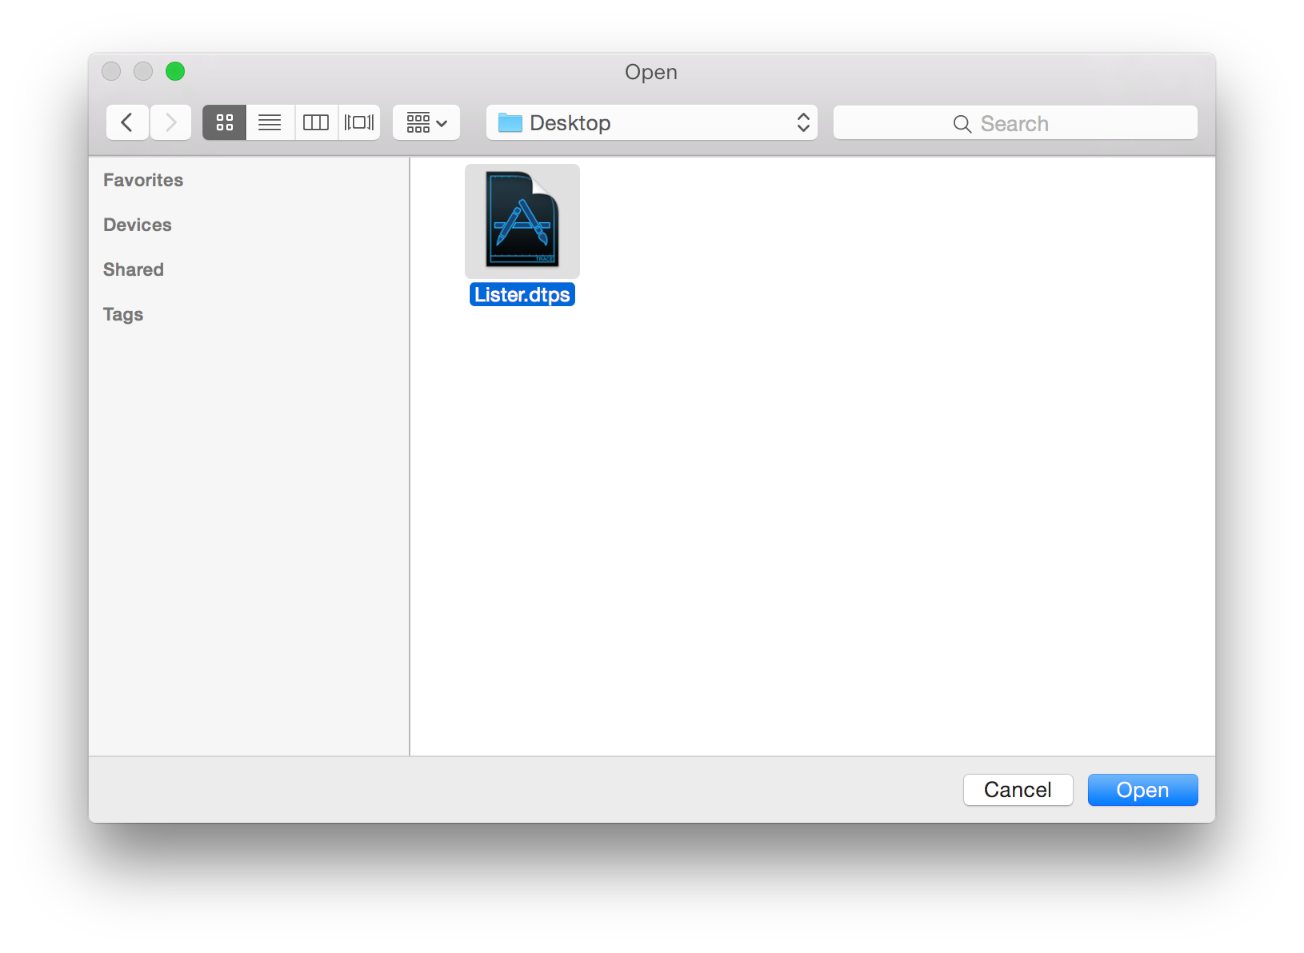
iprofiler -activitymonitor -T 5s -d ~/Desktop/ PathToYourAppOpen Instruments, and choose File > Open.
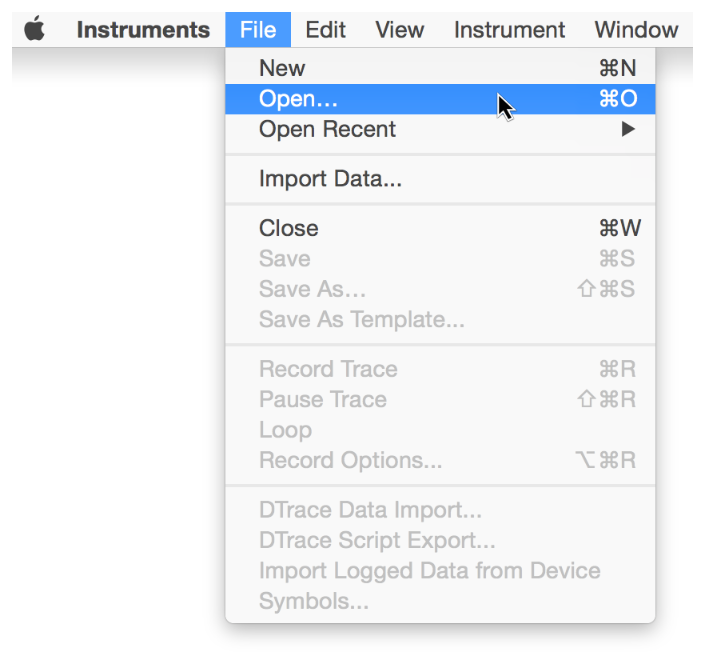
Find your saved .dtps file, and click Open.
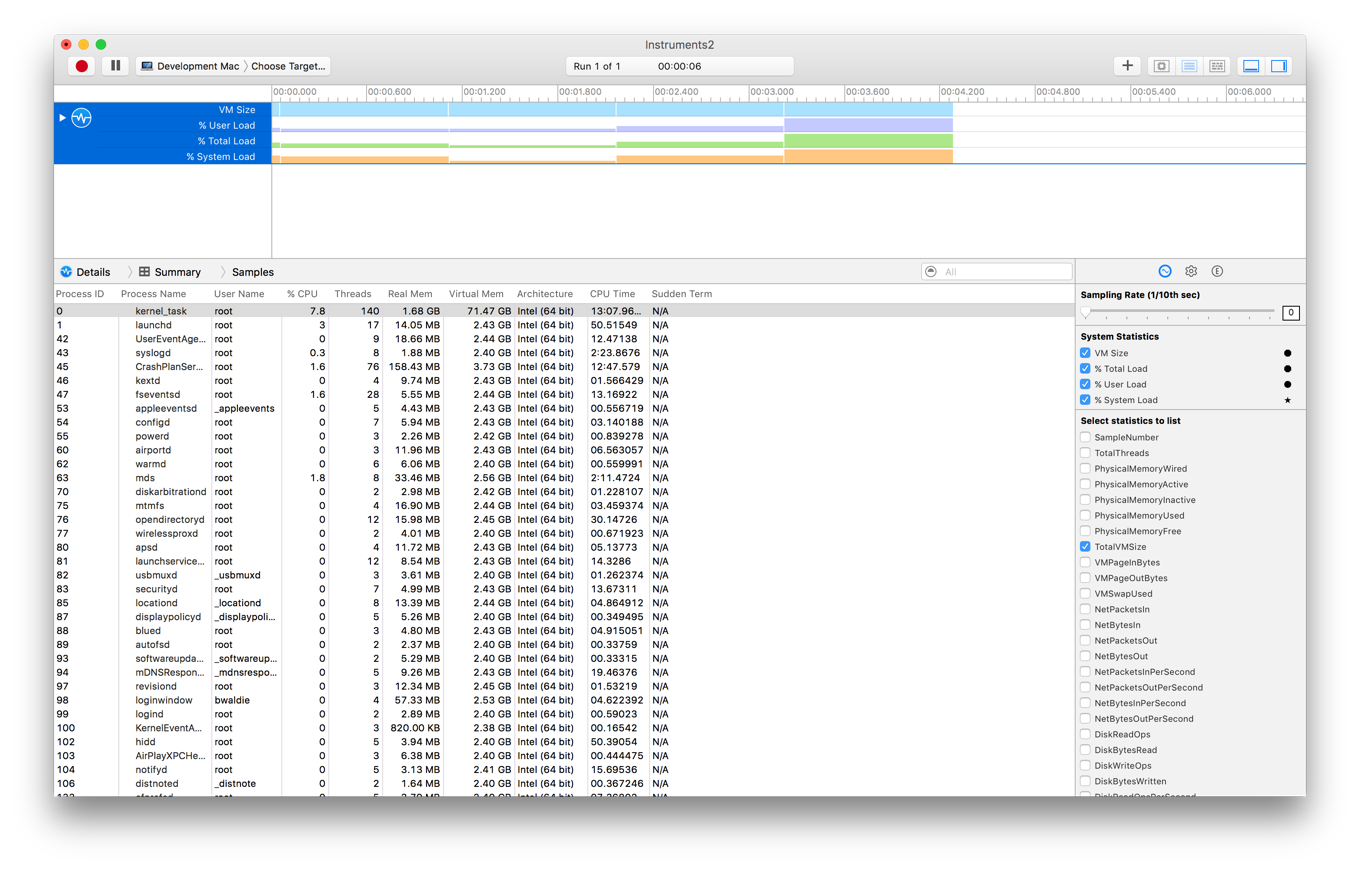
After opening the saved file, Instruments automatically adds the associated instruments to a trace document and populates them with the collected data. You can view and analyze the data in order to locate any issues with your app.
iprofiler supports the following types of profiles:
Activity Monitor. Monitors overall system activity and statistics, including CPU, memory, disk, and network. Activity Monitor also monitors all existing processes and parent/child process hierarchies.
Allocations. Measures heap memory usage by tracking allocations, including specific object allocations by class. Allocations can also record virtual memory statistics by region.
Counters. Collect performance monitor counter events using time- or event-based sampling methods.
Event Profiler. Samples the processes running on the system’s CPUs through low-overhead, event-based sampling.
Leaks. Measures general memory usage, checks for leaked memory, and provides statistics on object allocations by class as well as memory address histories for all active allocations and leaked blocks.
System Trace. Provides comprehensive information about system behavior. System Trace shows when threads are scheduled and shows all their transitions from user code into system code through either system calls or memory operations.
Time Profiler. Performs low-overhead, time-based sampling of processes running on the system’s CPUs.
iprofiler options
iprofiler provides the following set of configuration options for defining what data to collect.
Configuration option | Description |
|---|---|
| Provides a list of all supported instruments. |
| Provides a list of all supported instruments and a description of what each template does. |
| Executes the legacy Instruments command-line interface found in |
| Sets the length of time for which data is collected. Set duration in seconds (ns or n), milliseconds (nm or nms), or microseconds (nu or nus). The default is 10 seconds. |
| Sets the frequency with which a measurement is taken during the sample time. Set the interval to seconds (ns or n), milliseconds (nm or nms), or microseconds (nu or nus). The default is the Instruments app’s default sampling interval. |
| Limits the performance measurement to the final period of the Note: This option can be used only with the - |
| Specifies the destination path and the name used when saving the collected data. The default path is the current working directory. The default basename is the process name or process ID. |
| Designates the instrument to be run. Valid name options are - At least one template must be listed. You can run up to all seven templates at once. |
| Designates kernel stacks only for backtraces. If neither |
| Designates both kernel and user stacks for backtraces. If neither |
| When used with |
| Causes the Time Profiler template to profile all threads. If this value is not specified, Time Profiler profiles only running threads. |
| Attaches to a process that is already running. Specifying a string attaches the process whose name starts with that string. Specifying a process ID attaches it to the process associated with that process ID. The |
| Causes the target process to be launched for the duration of the measurement. Lists the executable and the arguments as if they are being invoked from the command line. |
iprofiler examples
A list of common iprofiler command-line examples are below.
This example collects data from all running processes for the current sampling duration set in Instruments using the Time Profiler and Activity Monitor instruments. The collected data is saved to the working directory as allprocs.dtps.
iprofiler -timeprofiler -activitymonitorThe following example opens and collects data from YourApp using the Time Profiler instrument. Data is collected for eight seconds, and the data is saved at /temp/YourApp_perf.dtps.
iprofiler -T 8s -d /temp -o YourApp_perf -timeprofiler -a YourAppThe following example collects data from the process with the 823 process ID using the Leaks and Activity Monitor instruments. Data is collected for 2500 milliseconds (2.5 seconds) and is saved to the working directory as YourApp_perf.dtps.
iprofiler -T 2500ms -o YourApp_perf -leaks -activitymonitor -a 823The following example opens and collects data from YourApp using the Time Profiler and Allocations instruments. Data is collected for the default amount of time set in Instruments and saved in /tmp/allprocs.dtps.
iprofiler -d /tmp -timeprofiler -allocations -a YourApp.appThe following example opens and collects data from YourApp found in /path/to with the argument arg1 using the Time Profiler and System Trace instruments. Data is collected for 15 seconds, but only the data collected in the last 2 seconds is saved. The data is saved to the working directory as YourApp_perf.dtps.
iprofiler -T 15 -I 1000ms -window 2s -o YourApp_perf -timeprofiler -systemtrace /path/to/Your.app arg1