
Instruments requires accurate information about your project to provide the best results. You get the most complete information if the system can see all symbols associated with your project. When addresses, rather than symbols, are displayed in trace documents generated by the Instruments analysis tool, you can manually provide the missing information. The mapping of addresses to their symbols is contained in a dSYM file. Typically, Instruments finds dSYM files automatically, based on the locations that Spotlight indexes and the paths you specify in Instruments preferences. However, you can point Instruments in the right direction when it can’t automatically find a dSYM. Once you do, Instruments can map addresses to their associated symbols and line number information.
Choose File > Symbols.
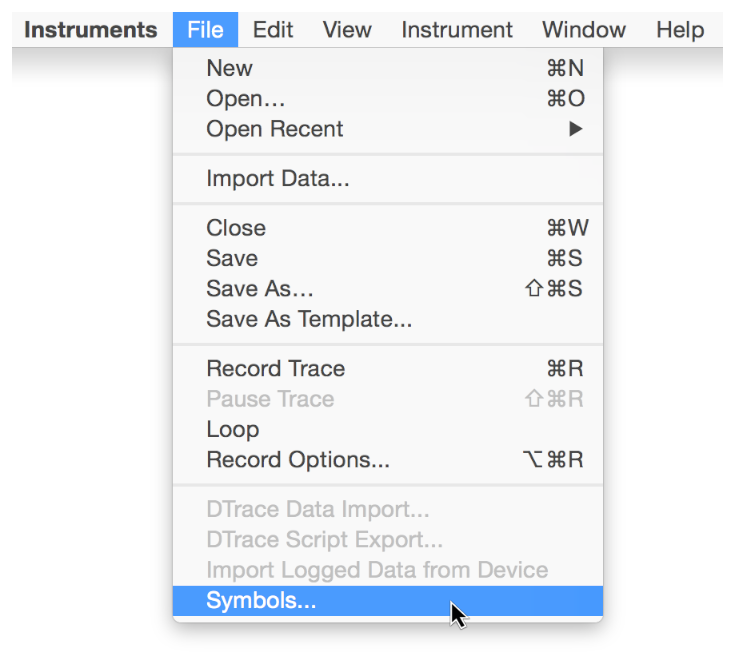
This command appears only after you run a trace or load a previously saved trace.
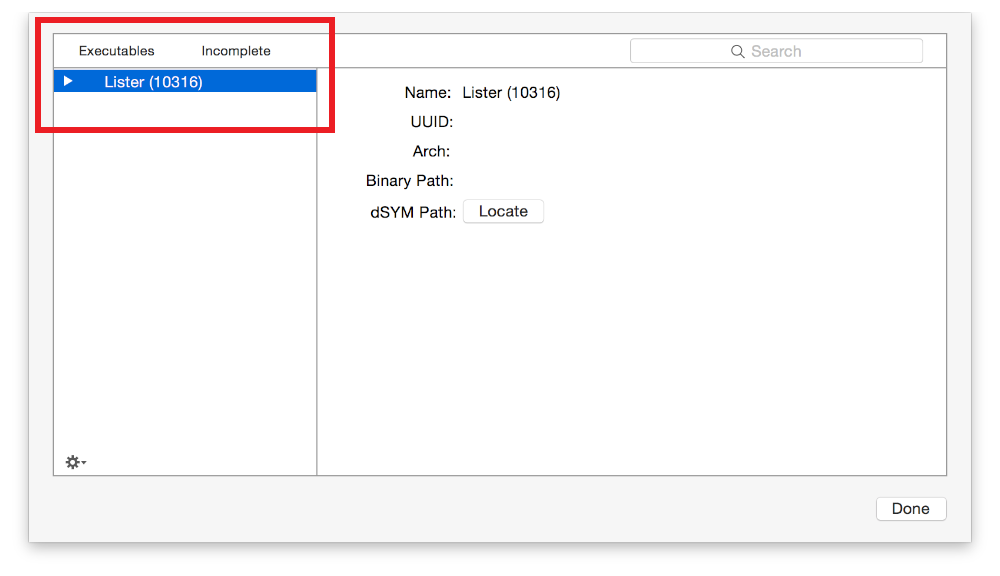
Select the executable (binary) or framework that is missing symbols.
Click the Locate button.
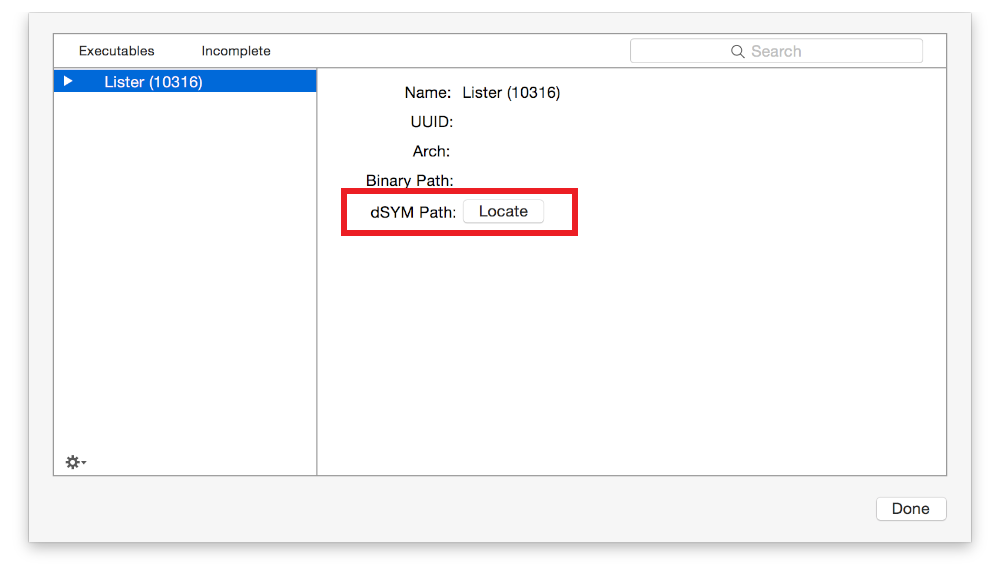
In the dialog that appears, select your symbol file or the folder that contains it.
Click Open.
To correctly display symbols in trace documents, Instruments needs access to the specific symbol files that were generated when the executable you are testing was built. Therefore, you may need to manually locate a dSYM file when you build on one computer and test performance on another.
The filter bar in the Symbols dialog lets you filter by executable and incomplete binaries and frameworks. You can also search for a specific binary or framework by entering text in the search field.
Note: By default, Xcode saves symbols as dSYM bundles in the Build folder. Xcode creates the default dSYM bundle path by adding the extension to the executable name. To generate dSYM bundles in Xcode, go to the Build Settings area for your project, and select Debug Information Format > Dwarf with dSYM File in the Build Options section..dSYM
CAUTION: Typically, when an address is displayed instead of a symbol, the address appears in black on the left and the owning library in gray on the right in the detail pane. You can identify these addresses by locating the appropriate dSYM file.
If the address is gray and no owning library is listed, you cannot display the symbolic name. A gray address with no library name means that at the time the trace was recorded, you did not have permission to see information about that process. This typically occurs when the Code Signing Identity in your build settings is set to a release/distribution identity for Release builds. Your Release build should use the same setting as your Debug build (typically, “iOS Developer”).