
Use the debug gauges in the Debug navigator to monitor a running app and find anomalies in its use of system resources.
Observe the debug gauges of a running app to become familiar with the gauges’ normal variation and the standard behaviors of the app over time. Then when you make changes to the app, look for differences in the debug gauge reports. If problems occur, inspect recent changes to your code to diagnose them. Each gauge report contains a button that opens Instruments Instruments so you can analyze a running app further.
There are seven types of debug gauges: CPU, Memory, Energy, Disk I/O, Network I/O, GPU, and iCloud. But not all of these gauges appear for all types of apps. For example, you must enable iCloud for the iCloud gauge to appear.
Before you begin, build and run your app and the debug area will open in the main window. When you pause your app or it stops at a breakpoint, the debug gauges freeze so you can examine the last state of your app.
In the Navigator area, click the Debug navigator button (![]() ) in the navigator bar.
) in the navigator bar.
If necessary, click the Show Debug Gauges button (![]() ) next to the name of the running app in the content area.
) next to the name of the running app in the content area.
The debug gauges for the app appear below.
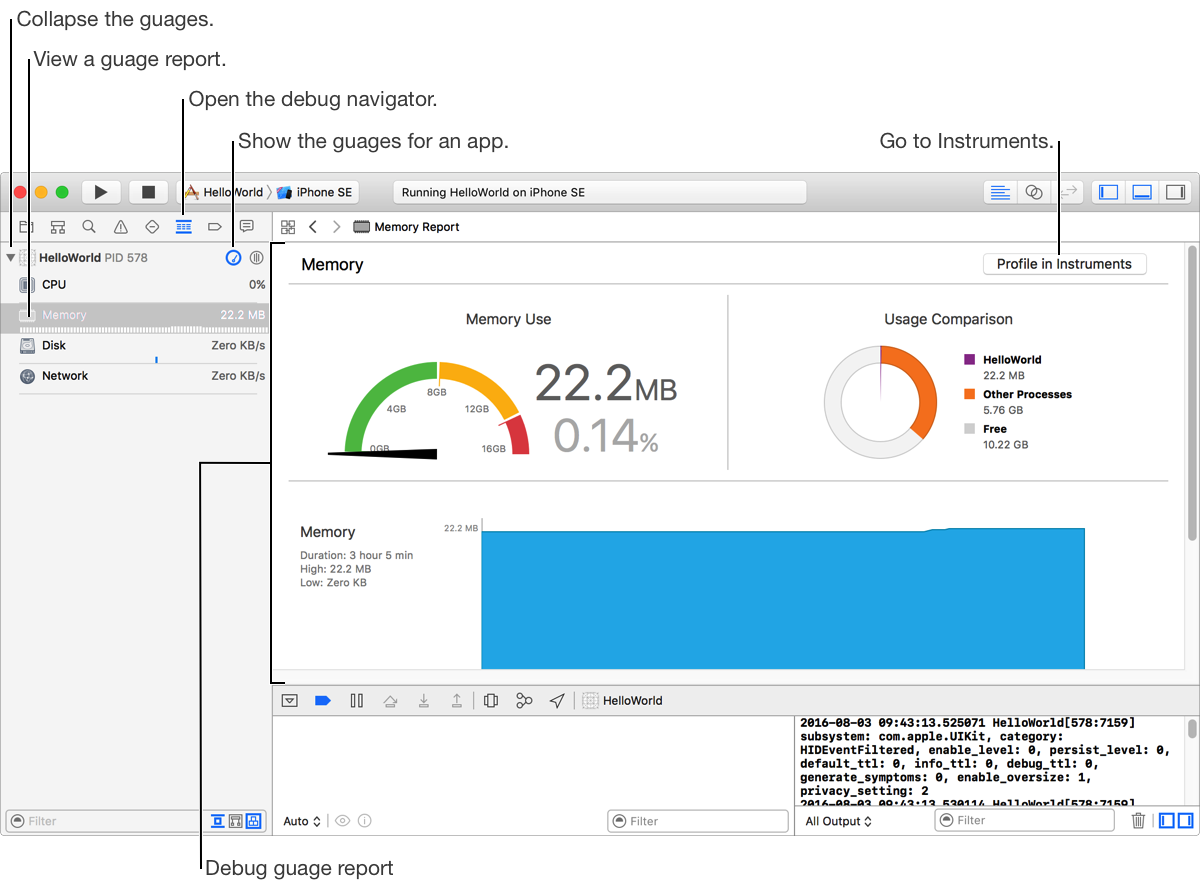
Click a gauge in the Debug navigator to see the detailed reports.
The gauge data and graphs appear in the editor area. The report for each type of gauge differs in the specifics but all follow a similar pattern.
Optionally, click “Profile in Instruments”, and in the sheet that appears, click Transfer.
Control of the app transfers to Instruments where you can continue analyzing your app.