Use the Debug navigator to examine running threads and stack information, or to monitor debug gauges while your app is running in a debug session. The Debug navigator opens automatically when you pause the execution of your app or your app reaches a breakpoint in the code.
To open the Debug navigator yourself, click the Debug Navigator button (![]() ) in the navigator area.
) in the navigator area.
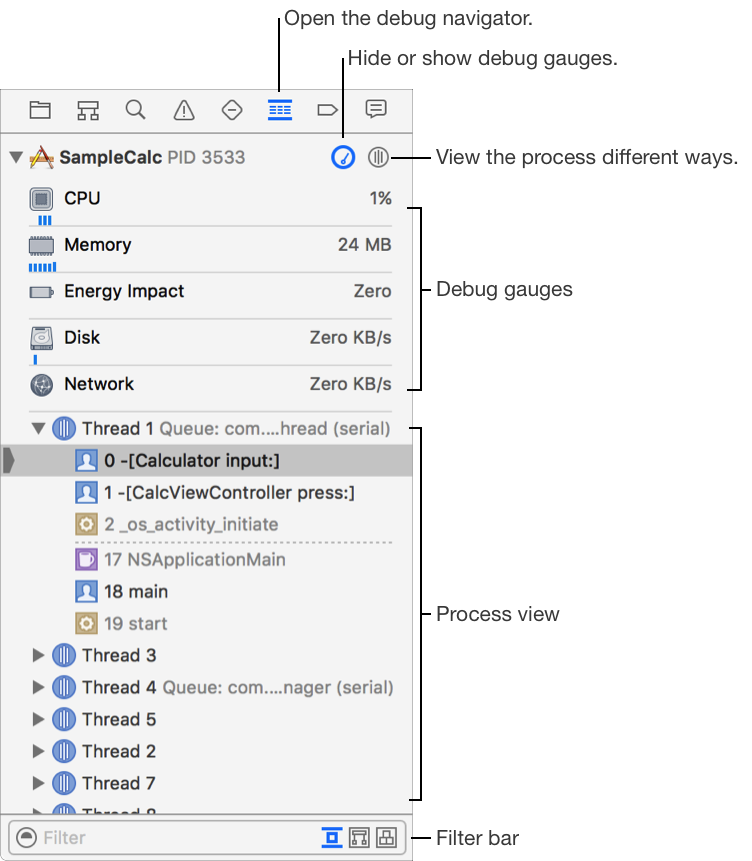
The standard display in the Debug navigator shows the debug gauges in the upper part and the process view in its lower part. Click the Hide/Show button (![]() ) to manage the display of the debug gauges for when you need more room in the process view during a debugging session.
) to manage the display of the debug gauges for when you need more room in the process view during a debugging session.
The process view selector menu (![]() ) controls the display in the process view. Use it to choose between viewing by thread or by queue, or to enable other displays for view debugging and memory debugging.
) controls the display in the process view. Use it to choose between viewing by thread or by queue, or to enable other displays for view debugging and memory debugging.