MultiMeter
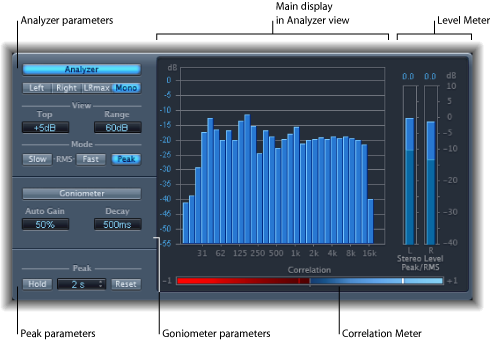
The MultiMeter provides a collection of professional gauge and analysis tools in a single window. It includes:
An Analyzer to view the level of each 1/3-octave frequency band
A Goniometer for judging phase coherency in a stereo sound field
A Correlation Meter to spot mono phase compatibility
An integrated Level Meter to view the signal level for each channel
You can view either the Analyzer or Goniometer results in the main display area. You switch the view and set other MultiMeter parameters with the controls on the left side of the interface.
While you can insert the MultiMeter directly into any channel strip, it is more commonly used in the master channel strip of the host application—when you are working on the overall mix.
There is also a surround version of the MultiMeter, with parameters for each channel and a slightly different layout. See Surround MultiMeter.
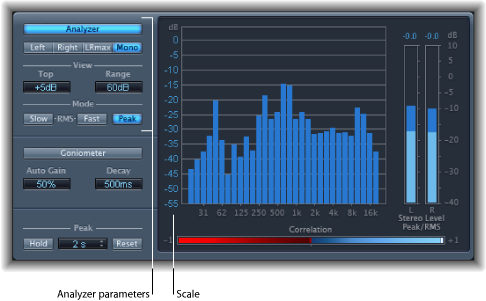
Using the MultiMeter Analyzer
In Analyzer mode, the MultiMeter’s main display shows the frequency spectrum of the input signal as 31 independent frequency bands. Each frequency band represents one-third of an octave. The Analyzer parameters are used to activate Analyzer mode, and to customize the way that the incoming signal is shown in the main display.
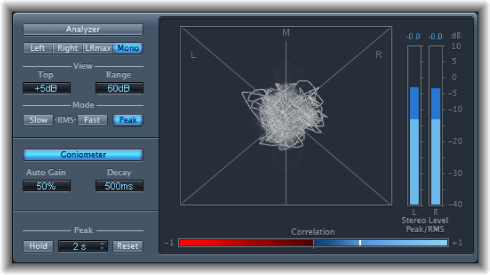
Using the MultiMeter Goniometer
A goniometer helps you to judge the coherence of the stereo image and determine phase differences between the left and right channels. Phase problems are easily spotted as trace cancellations along the center line (M—mid/mono).
The idea of the goniometer was born with the advent of early two-channel oscilloscopes. To use such devices as goniometers, users would connect the left and the right stereo channels to the X and Y inputs, while rotating the display by 45° to produce a useful visualization of the signal’s stereo phase.
The signal trace slowly fades to black, imitating the retro glow of the tubes found in older goniometers, while also enhancing the readability of the display.
- Auto Gain field: Sets the amount of display compensation for low input levels. You can set Auto Gain levels in 10% increments, or set it to off.
Note: To avoid confusion with the Auto Gain parameter found in other effects and processors (such as the compressors), Auto Gain is only used as a display parameter in the meters. It increases display levels to enhance readability. It does not change the actual audio levels.
Using the MultiMeter’s Level Meter
The Level Meter displays the current signal level on a logarithmic decibel scale. The signal level for each channel is represented by a blue bar.
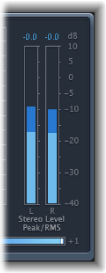
RMS and Peak levels are shown simultaneously, with RMS levels appearing as dark blue bars and Peak levels appearing as light blue bars. When the level exceeds 0 dB, the portion of the bar above the 0 dB mark turns red.
Current peak values are displayed numerically (in dB increments) above the Level Meter. Click in the display to reset peak values.
Using the MultiMeter’s Correlation Meter
The Correlation Meter gauges the phase relationship of a stereo signal. The Correlation Meter’s scale values indicate the following:
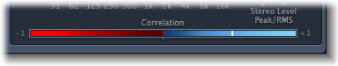
A +1 correlation value indicates that the left and right channels correlate 100%. In other words, the left and right signals are in phase and are the same shape.
Correlation values in the blue zone (between +1 and the middle position) indicate that the stereo signal is mono compatible.
The middle position indicates the highest allowable amount of left/right divergence, which is often audible as an extremely wide stereo effect.
When the Correlation Meter moves into the red area to the left of the center position, out-of-phase material is present. This will lead to phase cancellations if the stereo signal is combined into a mono signal.
Using the MultiMeter Peak Parameters
The MultiMeter Peak parameters are used to enable/disable the peak hold function and to reset the peak segments of all meter types. You can also determine a temporary peak hold duration.
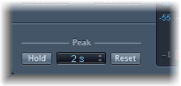
- Hold button: Activates peak hold for all metering tools in the MultiMeter, as follows:
- Analyzer: A small yellow segment above each 1/3 octave level bar indicates the most recent peak level.
- Goniometer: All illuminated pixels are held during a peak hold.
- Correlation Meter: The horizontal area around the white correlation indicator denotes phase correlation deviations in real time, in both directions. A vertical red line to the left of the correlation indicator shows the maximum negative phase deviation value. You can reset this line by clicking on it during playback.
- Level Meter: A small yellow segment above each stereo level bar indicates the most recent peak level.