Surround MultiMeter
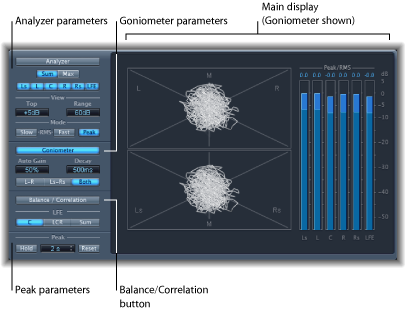
The surround version of the MultiMeter is specifically designed for analysis and metering of multichannel surround files. You can view either the Analyzer, Goniometer, or Correlation Meter results in the main display area. Use the controls on the left side of the interface to switch the view and set other MultiMeter parameters. The (Peak/RMS) Level Meter is visible on the right.
Although you can insert the Surround MultiMeter directly into any channel strip, it is more commonly used in the master channel strip of the host application—when you are working on the overall surround mix.
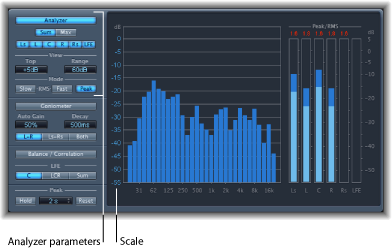
Using the Surround MultiMeter Analyzer
In Analyzer mode, the MultiMeter’s main display shows the frequency spectrum of the input signal as 31 independent frequency bands. Each frequency band represents one-third of an octave. The Analyzer parameters are used to activate Analyzer mode, and to customize the way that the incoming signal is shown in the main display.
Using the Surround MultiMeter Goniometer
A goniometer helps you to judge the coherence of the stereo image and determine phase differences between the left and right channels. Phase problems are easily spotted as trace cancellations along the center line (M—mid/mono).
The idea of the goniometer was born with the advent of early two-channel oscilloscopes. To use such devices as goniometers, users would connect the left and the right stereo channels to the X and Y inputs, while rotating the display by 45° to produce a useful visualization of the signal’s stereo phase. The signal trace slowly fades to black, imitating the retro glow of the tubes found in older goniometers, while also enhancing the readability of the display.
Because the Surround MultiMeter Goniometer is dealing with multichannel signals, the display is divided into multiple segments, as shown in the image. Each segment indicates a speaker position. When the surround panner is moved in a channel strip, the indicator changes accordingly. This indicates not only left and right channel coherence, but also the front-to-rear coherence.
- Auto Gain field: Sets the amount of display compensation for low input levels. You can set Auto Gain levels in 10% increments, or set it to off.
Note: To avoid confusion with the Auto Gain parameter found in other effects and processors (such as the compressors), Auto Gain is only used as a display parameter in the meters. It increases display levels to enhance readability. It does not change the actual audio levels.
- L–R, Ls–Rs, Both buttons: Determine which channel pairs are shown in the main display. When you are using the Surround MultiMeter in configurations with exactly two channel pairs (quad, 5.1, and 6.1 configurations), the Goniometer can display both pairs if you select Both. One pair (for L-R) appears in the upper half of the main display, and one (for Ls-Rs) appears in the lower half.
Using the Surround MultiMeter Level Meter
The Level Meter displays the current signal level on a logarithmic decibel scale. The signal level for each channel is represented by a blue bar.
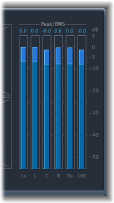
RMS and Peak levels are shown simultaneously, with RMS levels appearing as dark blue bars, and Peak levels appearing as light blue bars. When the level exceeds 0 dB, the portion of the bar above the 0 dB mark turns red.
Current peak values are displayed numerically (in dB increments) above the Level Meter. Click in the display to reset peak values.
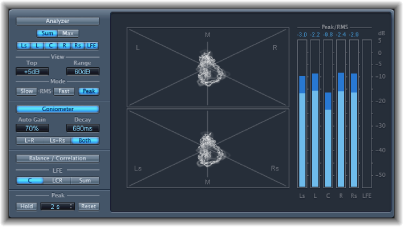
Using the Surround MultiMeter Balance/Correlation Parameters
The Surround MultiMeter’s Correlation Meter gauges the balance or sound placement between all incoming signals. Strongly correlated signals are shown as sharp markers and less strongly correlated signals as a blurred area. Activate the Surround MultiMeter’s Balance/Correlation button to view the Correlation Meter in the main display.
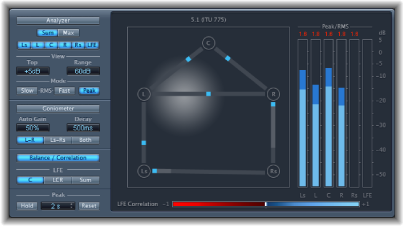
Depending on the chosen surround format, a number of points that indicate speaker positions are shown (L, R, C, Ls, Rs in a 5.1 configuration is displayed in the figure). Lines connect these points. The center position of each connecting line is indicated by a blue marker.
A gray ball indicates the surround field/sound placement. As you move the surround panner of the channel strip, the ball in the Correlation Meter mirrors your movements. The blue markers also move in real time, with shaded gray lines indicating the divergence from the centered positions on each of the connecting lines.
The LFE channel Correlation Meter is shown at the bottom of the main display. The horizontal area around the white correlation indicator denotes phase correlation deviations in real time. This is shown in both directions. A vertical red line to the left of the correlation indicator shows the maximum negative phase deviation value. You can reset this line by clicking on it during playback.
The LFE Correlation Meter’s scale values indicate the following:
A +1 correlation value indicates that the signal is balanced.
Correlation values in the blue zone (between +1 and the middle position) indicate that the signal is mono compatible.
The middle position indicates the highest allowable amount of channel divergence.
When the meter moves into the red area to the left of the center position, out-of-balance material is present.
Surround MultiMeter Peak Parameters
The Surround MultiMeter offers the following Peak parameters:
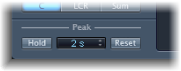
- Hold button: Activates peak hold for all metering tools in the Surround MultiMeter, as follows:
- Analyzer: A small yellow segment above each level bar indicates the most recent peak level.
- Goniometer: All illuminated pixels are held during a peak hold.
- Level Meter: A small yellow segment above each level bar indicates the most recent peak level.
- Balance/Correlation Meter: The horizontal area around the white correlation indicator denotes phase correlation deviations in real time, in both directions.
Note: This meter must be manually opened by clicking on the Balance/Correlation button.