
Create a column, bar, line, area, or pie chart
Tap
 , then tap
  .
.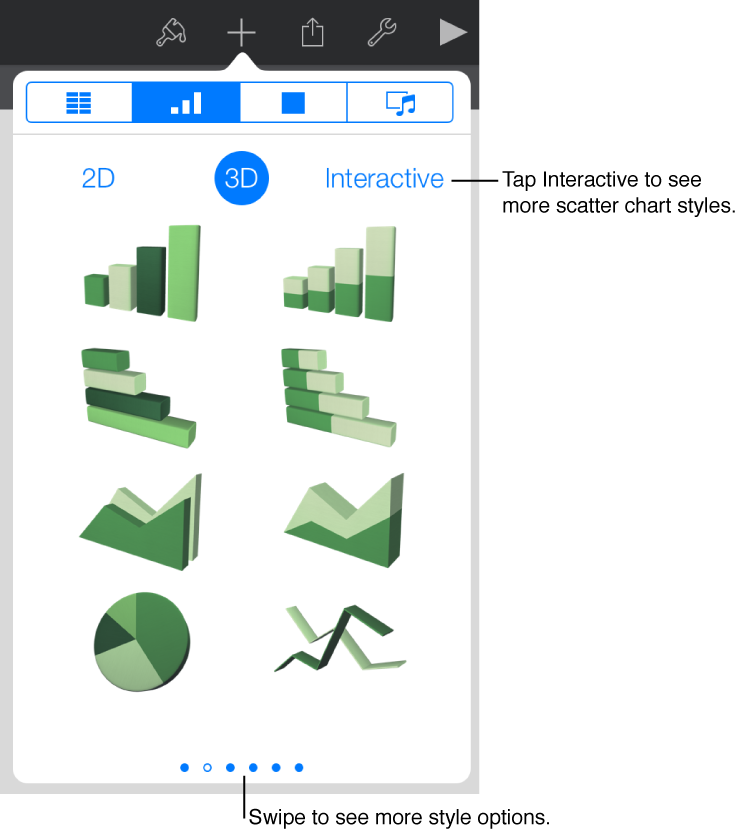
Tap 2D, 3D, or Interactive to see options for the type of chart you want to add, then tap a chart to add it.
Swipe left or right to see more options for each type of chart.
Drag the chart to where you want it.
If you add a 3D chart, you see
 at its center. Drag this control at any time to adjust the chart’s orientation.
To add data to the chart, tap the chart, tap Edit Data, then enter data in the chart data editor that appears.
To change whether rows or columns are plotted as data series, tap Edit Data, tap
 , then tap your preference.
Tap Done.