For some instruments, the extended detail area in the inspector pane shows additional information about the item currently selected in the detail pane. This extended detail information can include a description of the probe or event that was recorded, a stack trace, and the time when the information was recorded, as well as other information.
Do one of the following:
Choose View > Inspectors > Show Extended Detail or Hide Extended Detail (or press Command-1).
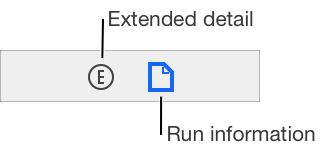
Click the Extended Detail button (![]() ) in the navigation bar at the top of the inspector pane.
) in the navigation bar at the top of the inspector pane.
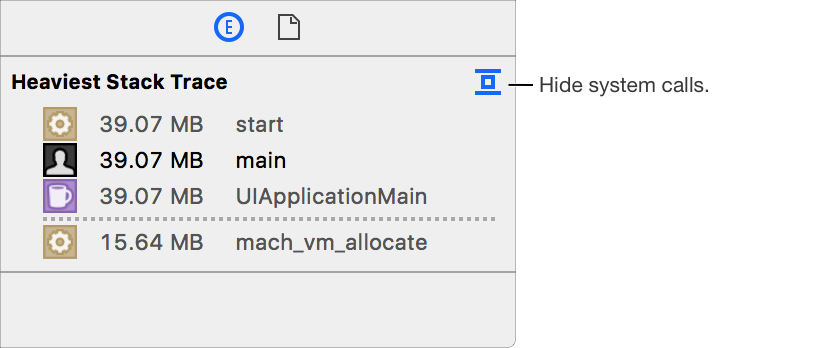
You can hide system calls in a stack trace by clicking the Collapse button ![]() at the top of the stack trace area in the extended detail area of the inspector.
at the top of the stack trace area in the extended detail area of the inspector.