
The detail pane shows detailed information about the data collected by the instruments in your trace document. Select an individual instrument in the timeline pane to see the data it collected while profiling.
The detail pane consists of three main areas, the navigation bar, the collected data area, and the filter and configuration bar.
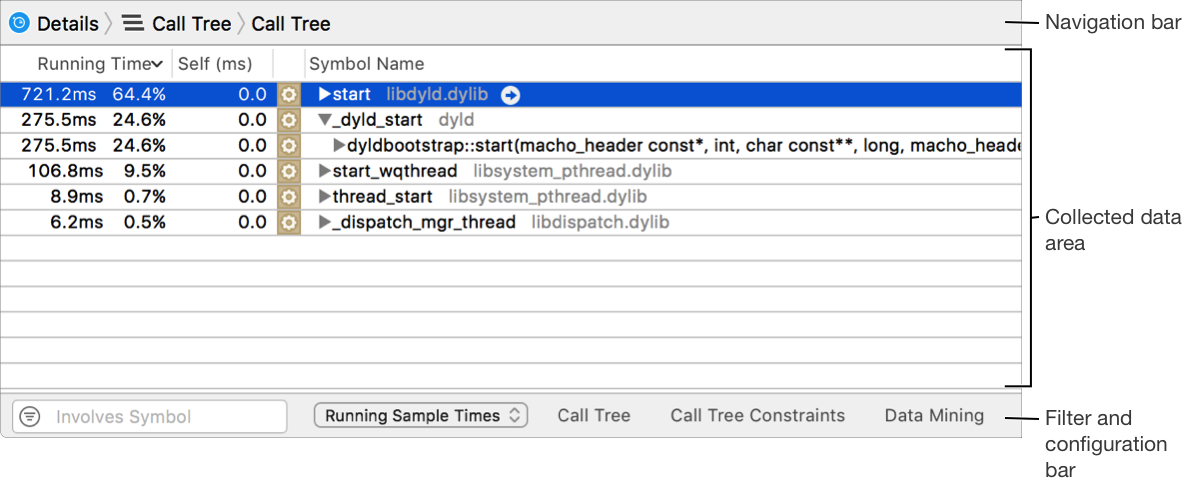
Navigation bar
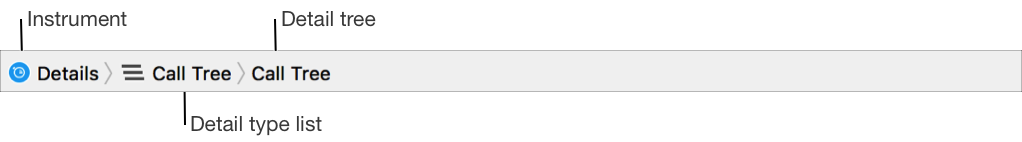
The navigation bar at the top of the detail pane helps you browse through collected data.
You can use the navigation bar to switch between types of data and to navigate through different levels of data.
Instrument: Icon of the currently selected instrument in the timeline pane. Click this to view the console for the instrument.
Detail type list: Allows you to navigate between different types of data. The options displayed here vary, depending on the actively selected instrument. For many instruments, the list includes things like a summary of data, a call tree, and a console.
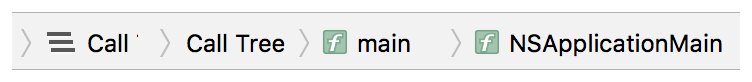
Detail tree: Keep track of where you are in the hierarchy as you navigate through the data in the detail pane. Click a branch of the tree to move back up the hierarchy to the corresponding data.
Collected data area
The collected data area shows you all of the data for the selected instrument, typically in tabular format. The content displayed here varies significantly from instrument to instrument. For example, the Activity Monitor instrument displays process, CPU, and thread information, and much more.
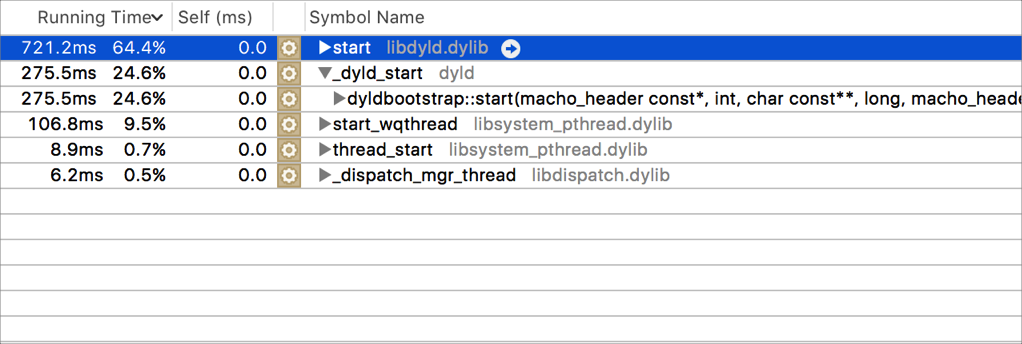
Often, individual symbols and data points within this area contain navigation buttons (![]() ), which appear when you move your pointer over them. You can click these buttons to move deeper into the data. As you do, the detail tree in the navigation bar updates to reflect where you are in the hierarchy.
), which appear when you move your pointer over them. You can click these buttons to move deeper into the data. As you do, the detail tree in the navigation bar updates to reflect where you are in the hierarchy.
Filter and configuration bar
The filter and configuration bar at the bottom of the detail pane helps you filter the collected data and configure how that data is displayed.
Filter field: Allows you to filter collected data for a specific term. Click the filter field’s menu for some additional filtering options. You can also filter collected data more extensively by adjusting display settings in the display configuration popover.
Display configuration controls: Refine the displayed results by filtering, sorting, and data mining. The controls vary from instrument to instrument and can include menus for selecting different views of the results, and popovers for constraining the data that is shown.
