
Profile your app in Instruments to examine and optimize its behavior and performance.
In the main window, choose Edit Scheme from the scheme menu in the toolbar.
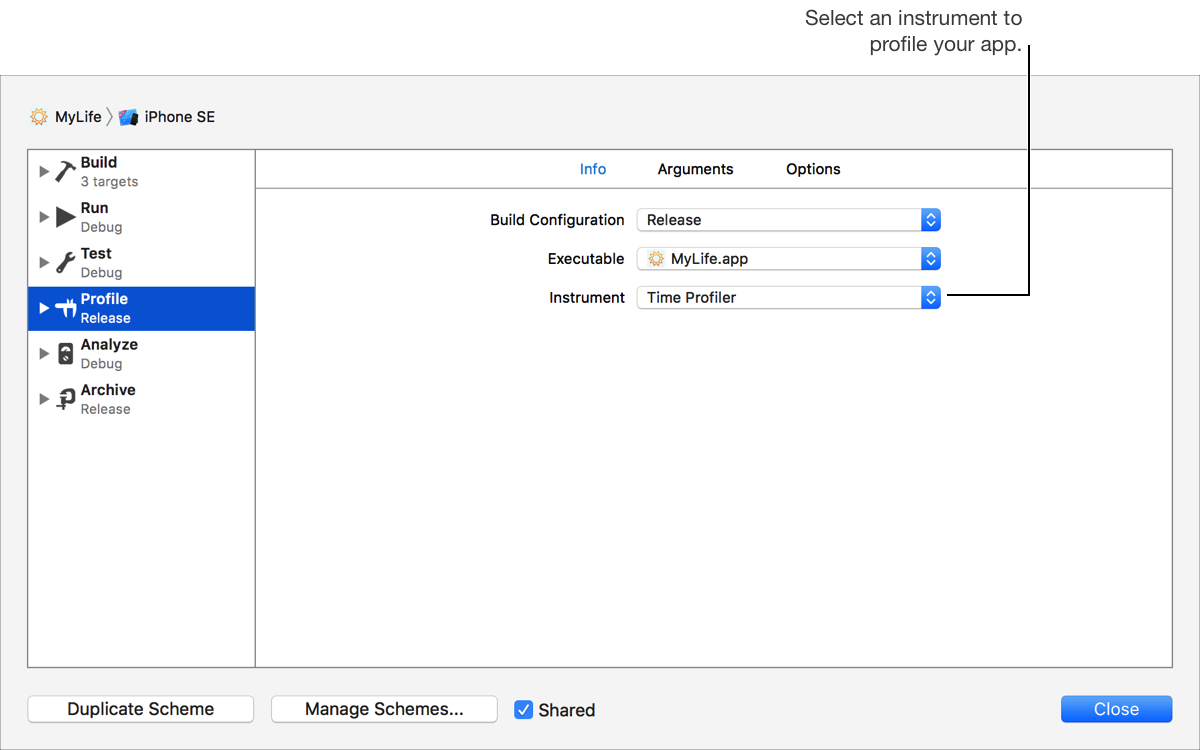
In the left column, select the Profile scheme action.
At the top of the right column, click Info and choose an instrument from the Instrument pop-up menu. To defer this decision until profiling your app, choose Ask on Launch.
If desired, click Arguments and specify any command-line arguments or environment variables for your app when it runs. By default, Xcode uses any arguments configured in the Run scheme action.
If desired, click Options and enable testability. For macOS apps, you can also enable persistent state restoration, debugging while using the document Versions Browser, and a custom working directory.
Click Close.
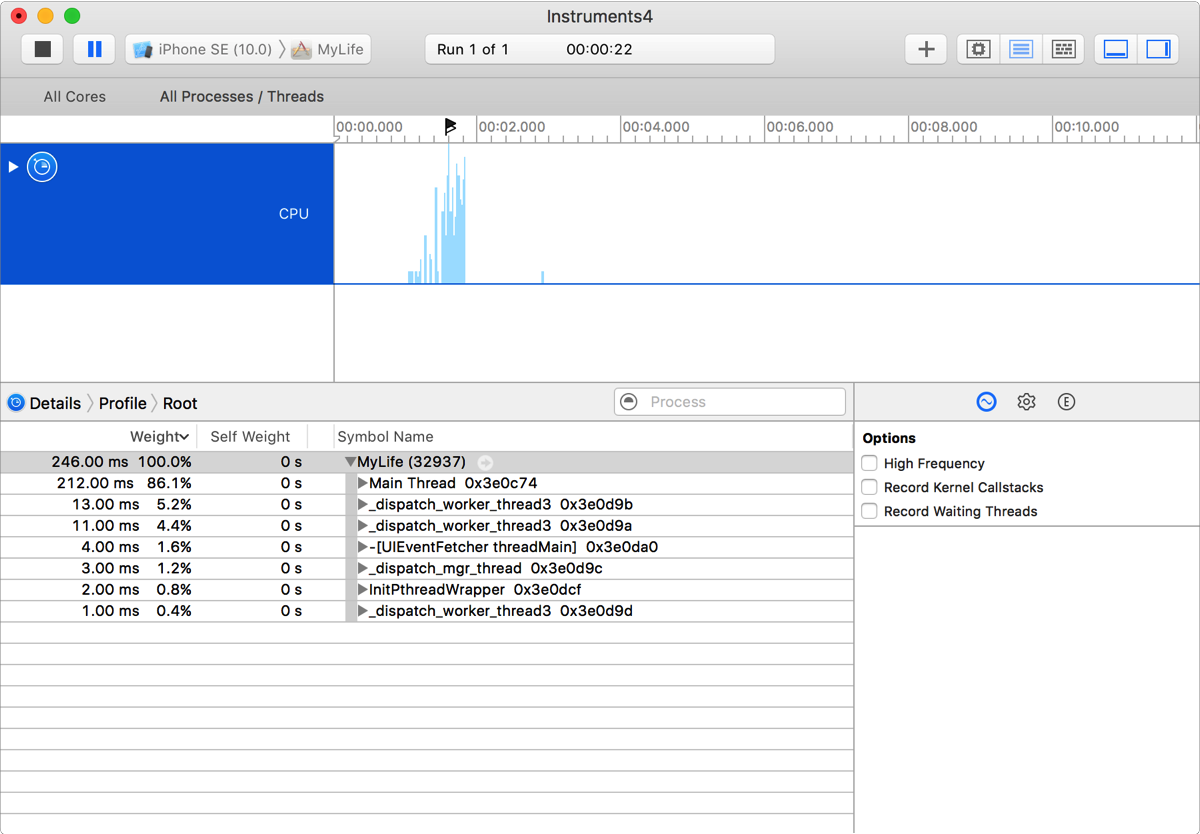
Choose Product > Profile.
Instruments launches, and you can begin examining your app.