
While testing and debugging your app, use the scheme editor to enable runtime memory management diagnostics and logging options.
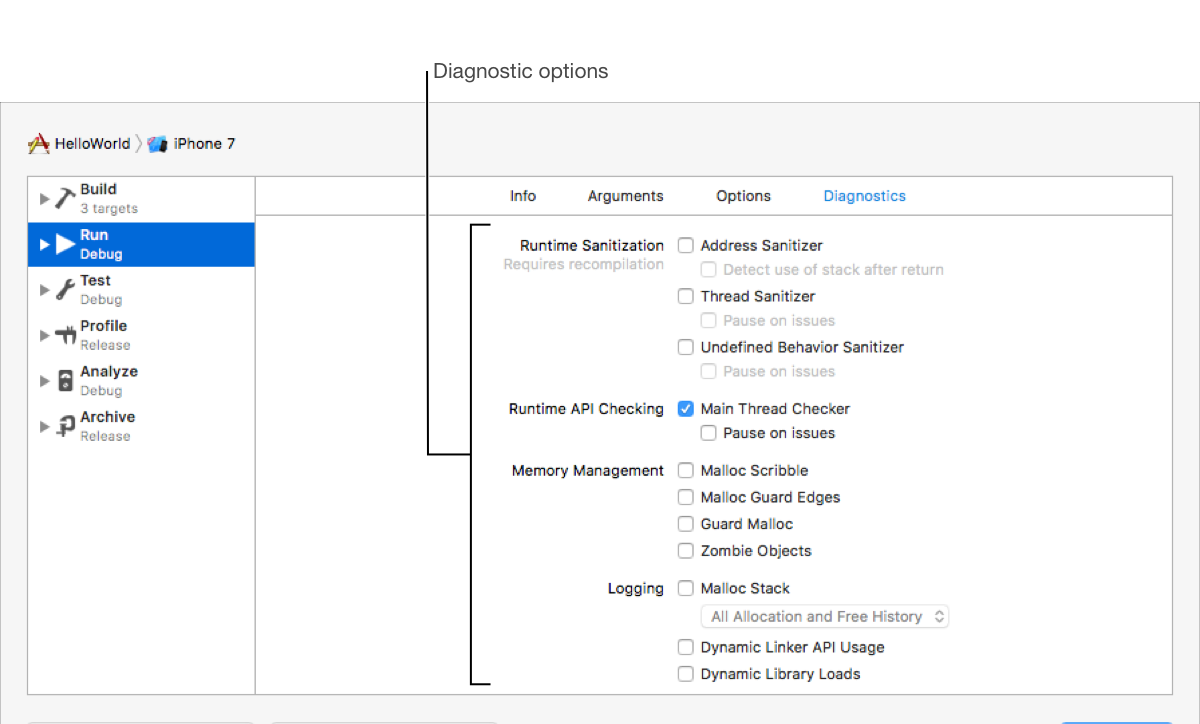
Runtime Sanitization: Address Sanitizer, Thread Sanitizer, Undefined Behavior Sanitizer
Runtime API Checking: Main Thread Checker
Memory Management: Malloc Scribble, Malloc Guard Edges, Guard Malloc, Zombie Objects
Logging: Malloc Stack, Dynamic Linker API Usage, Dynamic Library Loads
In the main window, choose Edit Scheme from the scheme menu in the toolbar.
In the left column, select the Run scheme action.
Click Diagnostics at the top of the right column.
Enable the desired runtime diagnostics.