
View the detailed result of an executed statement in a popover Quick Look preview or by adding a results view to the playground page. Some results can be viewed in different ways. For example, the set of results for a number variable in a loop can be viewed as a graph of the values for each iteration of the loop, a set of values for each iteration, or the value of the last iteration.
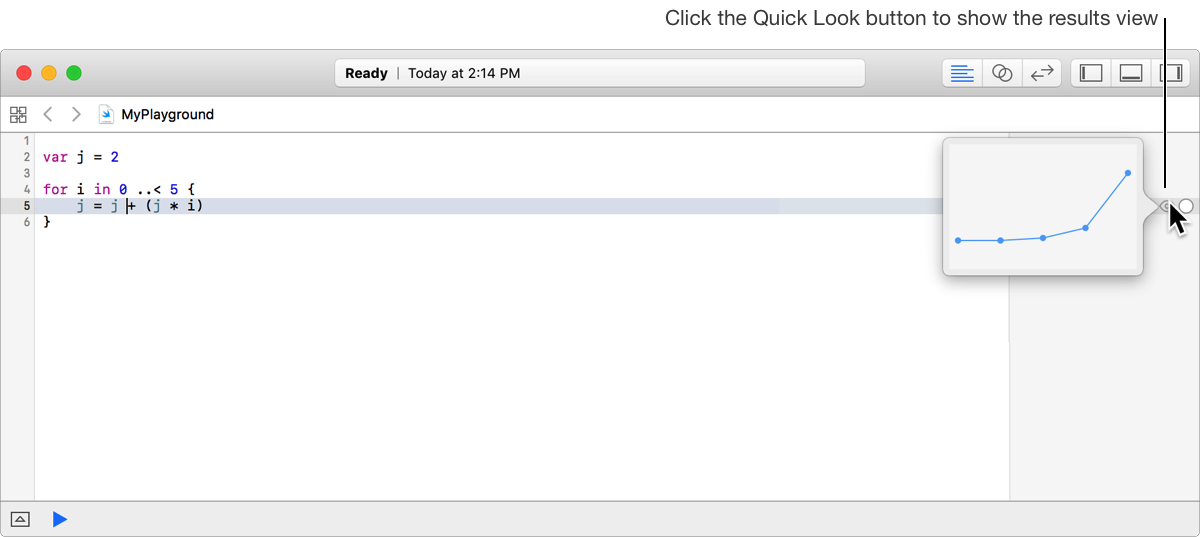
Move the pointer along the right edge of the sidebar to show the Quick Look button for a result.
Click the button to see the result’s value displayed in an appropriate representation.
The screenshot shows a Quick Look for the values of a variable inside a for loop.
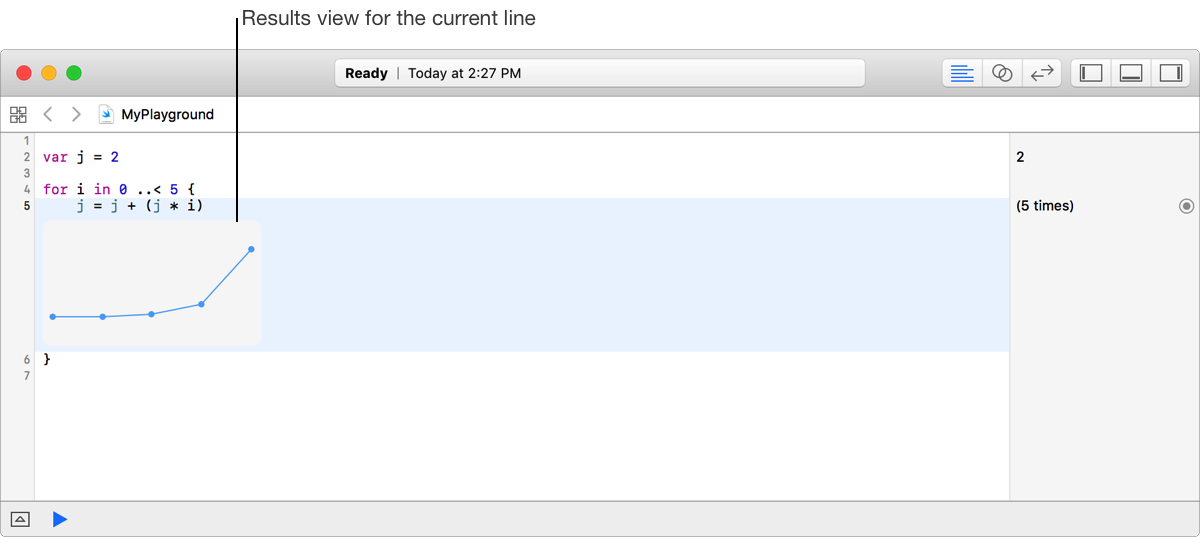
Move the insertion point to the line of code that generates the result you want to show.
Choose Editor > Show Result for Current Line.
A results view is added to the editor below the line containing the pointer, as shown in the screenshot.
Move the insertion point to the line of code above the results view.
Choose Editor > Hide Result for Current Line.
Move the pointer to an edge or corner of the results view.
The pointer changes to a double-headed arrow.
Drag the edge of the results view to resize it.
To allow the results view to be resized when the window is resized, drag the right edge of the results view as close to the results sidebar as possible.
To prevent the results view from being resized when the window is resized, drag the right edge away from the results sidebar.
Some types of results can be viewed in different modes. For example, the value of a number in a loop can be viewed as a graph, a series of values, or as the last value.
Select the results view in the source editor.
Choose Editor > Result Display Mode, and choose a new display format. Not all formats may be available.
Latest value: Displays the current value for the selected results view.
Value history: Displays all the values of the selected results view.
Graph: Displays the values as a graph.