
Use the view debugger to inspect the view hierarchy of your paused app. The debugger includes a hierarchical list of interface objects, a canvas with an exploded 3D rendering of the hierarchy, and inspectors for the attributes of an object and the size of a view.
To open the view debugger, click the Debug View Hierarchy button (![]() ) at the top of the debug area.
) at the top of the debug area.

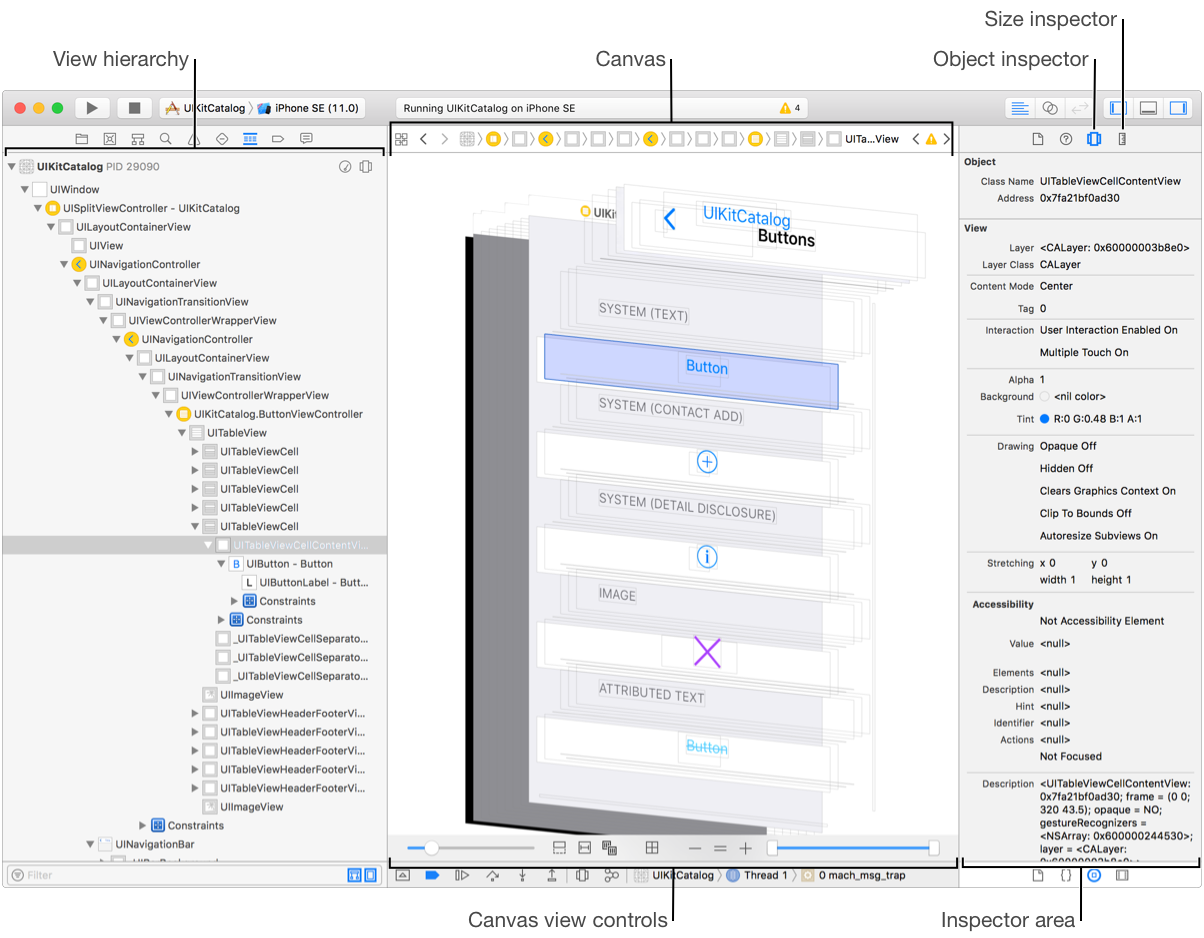
The view hierarchy in the navigator area shows a hierarchical list of the view controllers, views, and constraints in your paused app. Selecting an object in the list highlights the corresponding object on the canvas. You can use the filter bar to display only those view controllers, views, and constraints that match the filter string.
The canvas shows a 3D graphical rendering of the views and controllers. Use the controls at the bottom of the debugger to show different meta information such as constraints, and to adjust how the hierarchy is presented. Selecting a SceneKit object replaces the canvas with the SceneKit scene editor.
The Object inspector (![]() ) shows the class, memory address, attribute values, and an allocation stack trace for the selected view controller, view, or constraint.
) shows the class, memory address, attribute values, and an allocation stack trace for the selected view controller, view, or constraint.
The view debugger Size inspector (![]() ) shows the frame and bounds rectangle, view position, constraints, and Auto Layout settings for a view object.
) shows the frame and bounds rectangle, view position, constraints, and Auto Layout settings for a view object.
The view debugger shows a snapshot of the views, view controllers, and constraints in your running app. The objects include those added by the system such as container views, spacer views, and implicit constraints.
The runtime issues indicator appears in the Activity indicator area of the toolbar when the view debugger detects ambiguous constraints. The indicator is also shown next to any view with ambiguous constraints in the navigator area. Selecting a view with ambiguous constraints shows the indicator in the view debugger Size inspector next to a description of the issue.
The objects in the view hierarchy may contain:
User interface elements that you add to your app. A single user interface element you add may be composed of more than one view by the system.
Views added by the system such as table view cell separators or visual effect views.
View controllers added by the system.
SpriteKit nodes.