
In Numbers, charts are created using data from a table. To create any type of chart, you can select the data first, then create a chart that displays the data. When you change the data in the table, the chart updates automatically.
Select the table cells with the data you want to use, or to add data from an entire row or column, click the table, then click the number or letter for that row or column.
You can select cells from one or more tables, including tables on different sheets. While editing a chart’s data references, ![]() appears on the tab for any sheet that contains data used in the chart.
appears on the tab for any sheet that contains data used in the chart.
If the data in your table is categorized, you can also select a column to plot the results of a summary row calculation.
Note: To chart individual data points in a categorized table, make sure the first cell you select is not in a summary row. If the selection includes a group that is collapsed, only data from the visible groups is plotted.
Click ![]() , then click 2D, 3D, or Interactive.
, then click 2D, 3D, or Interactive.
Click the left and right arrows to see more style options.
Click a chart or drag it to the sheet.
If you add a 3D chart, you see ![]() at its center. Drag this control to adjust the chart’s orientation.
at its center. Drag this control to adjust the chart’s orientation.
To change whether rows or columns are plotted as data series, click Edit Data References, then click the pop-up menu in the bar at the bottom of the window and choose an option.
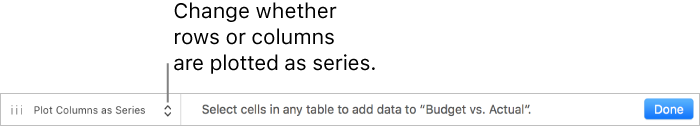
Click Done in the bar at the bottom of the window.
You can adjust the data reflected in the chart at any time. To learn how, see Modify chart data references.