![]() When Show Advanced Tools is selected in the Advanced preferences pane, you can edit the Parameter graph for each parameter mapping to remap (or scale) input values from the screen control to different output values. The graph includes a series of preset curves that you can apply. The graph for one mapped parameter can be copied and pasted to another mapped parameter. You can also invert the range of values or reset the graph.
When Show Advanced Tools is selected in the Advanced preferences pane, you can edit the Parameter graph for each parameter mapping to remap (or scale) input values from the screen control to different output values. The graph includes a series of preset curves that you can apply. The graph for one mapped parameter can be copied and pasted to another mapped parameter. You can also invert the range of values or reset the graph.
In the Parameter Mapping area of the Smart Control inspector, click the Scaling: Open button.
The Parameter graph window opens. The title of the graph window shows the parameter name.
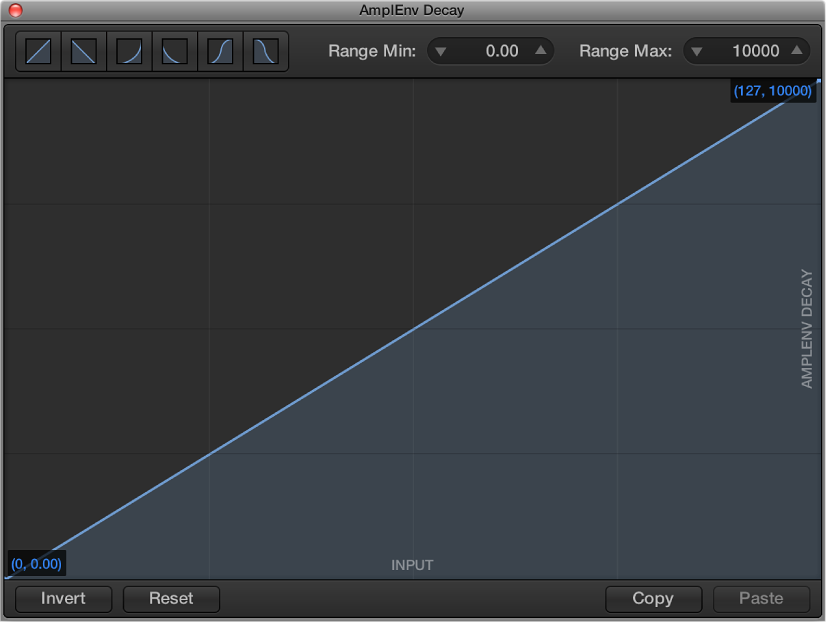
The graph shows the range of input values on the horizontal (x) axis, moving from left to right, and the range of output values on the vertical (y) axis, moving from bottom to top.
In the graph window, you have several ways of working: you can edit the graph curve directly, set the graph to use one of the predefined curves, or change the minimum and maximum range values for the graph.
Do any of the following:
Click a curve button (in the upper-left part of the window) to use one of the preset curves.
Click the curve at the location where you want to add a curve point, then drag the curve point to the desired value. Drag horizontally to change the input value or vertically to change the output value.
As you drag, the current values of the curve point appear next to the pointer.
Double-click the curve at the location where you want to add a curve point, then edit the values for the curve point.
Option-click any part of the curve (except a curve point), then drag the dotted part of the curve to make the curve nonlinear.
Click Invert to invert the values of the curve.
Click Reset to reset the graph to its original (default) values.
Continue adding and adjusting points until you’re happy with the result.
When you're finished, click the close button at the upper-left corner of the graph window.
Click the Copy button on the right side of the graph window.
Click the Paste button on the right side of the graph window.