
For some instruments, you can display detail pane data in more than one format. For example, the Activity Monitor instrument allows you to view a summary of data, parent child information, and a list of samples.
Choose the appropriate mode from the detail type list in the navigation bar of the detail pane.
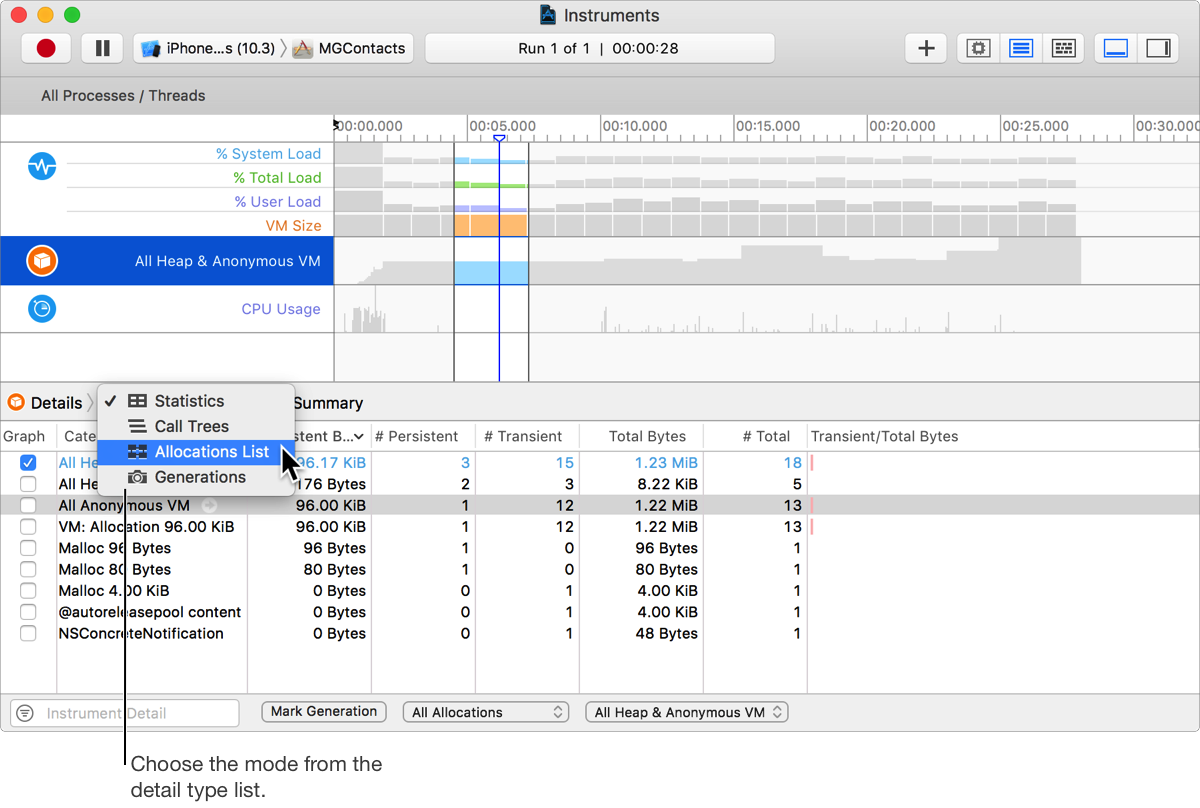
Which modes an instrument supports depends on the type of data gathered by that instrument.
For some detail types, like the Allocations instrument’s call tree mode, you can use disclosure triangles in certain detail pane rows to dive further down into the corresponding hierarchy. Clicking a disclosure triangle expands or closes just the given row.
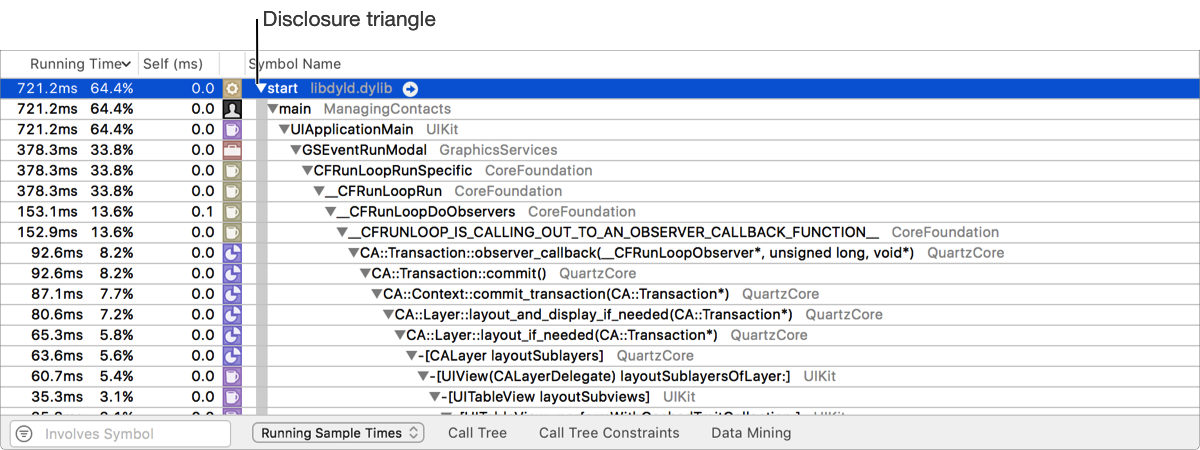
Tip: Option-Click the disclosure triangle to recursively expand the children of the row to places where changes in the data occur. Shift-Option-Click the disclosure triangle to recursively expand all the children of the row.
When viewing a call tree, many instruments include options to hide system calls and invert the call tree. These options are found in the Call Tree area under Display Options in the inspector pane. Hiding system calls allows you to quickly filter for calls made by your app. Inverting the call tree allows you to see the heaviest calls first.